Fig. 12
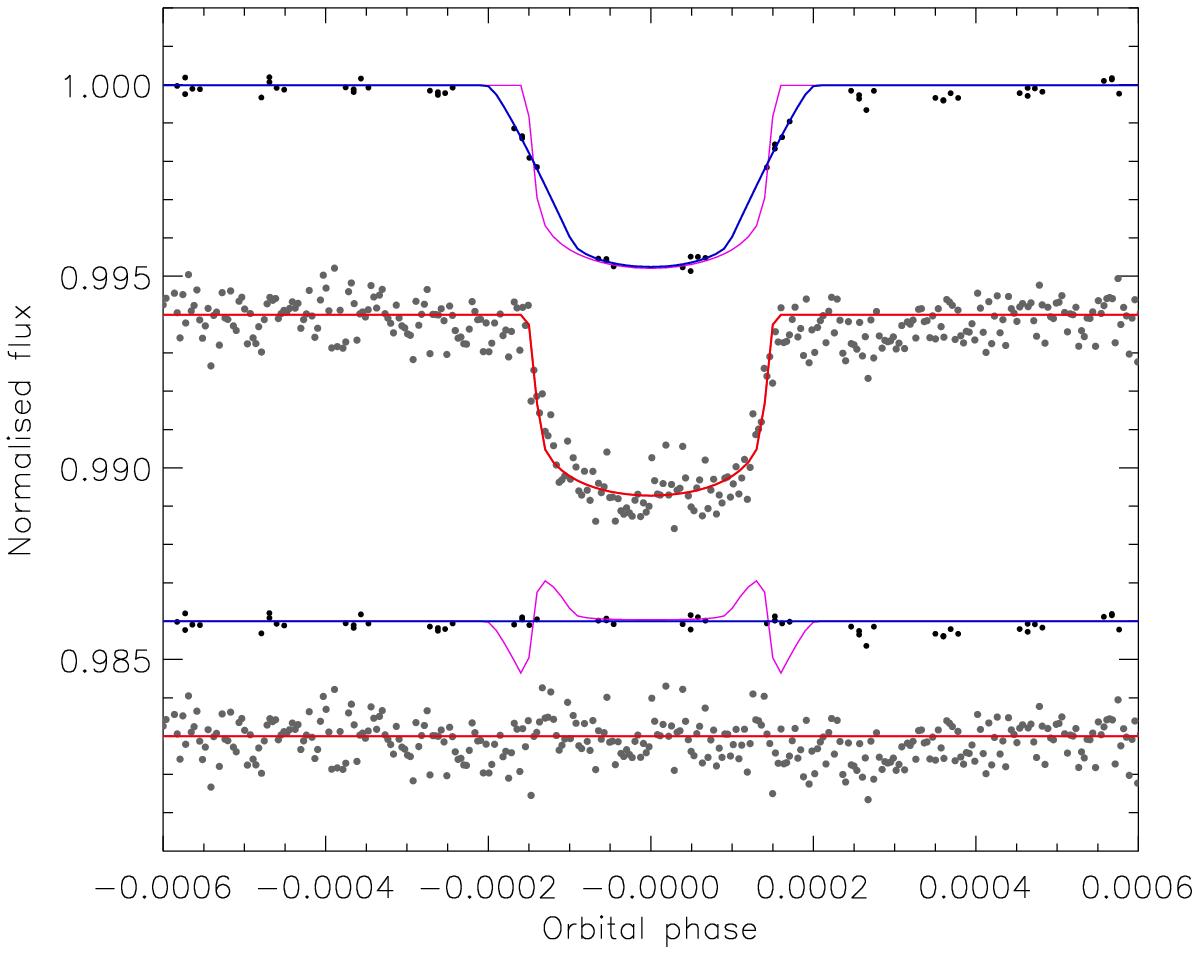
Kepler LC (above) and SC (below) light curves compared to the best fits from jktebop neglecting third light. The residuals are plotted at the base of the figure, offset from unity. The blue and the purple lines through the LC data show the best-fitting model with and without numerical integration, and the ones through the residuals show the difference between this model with and without numerical integration.
Current usage metrics show cumulative count of Article Views (full-text article views including HTML views, PDF and ePub downloads, according to the available data) and Abstracts Views on Vision4Press platform.
Data correspond to usage on the plateform after 2015. The current usage metrics is available 48-96 hours after online publication and is updated daily on week days.
Initial download of the metrics may take a while.