Fig. 7
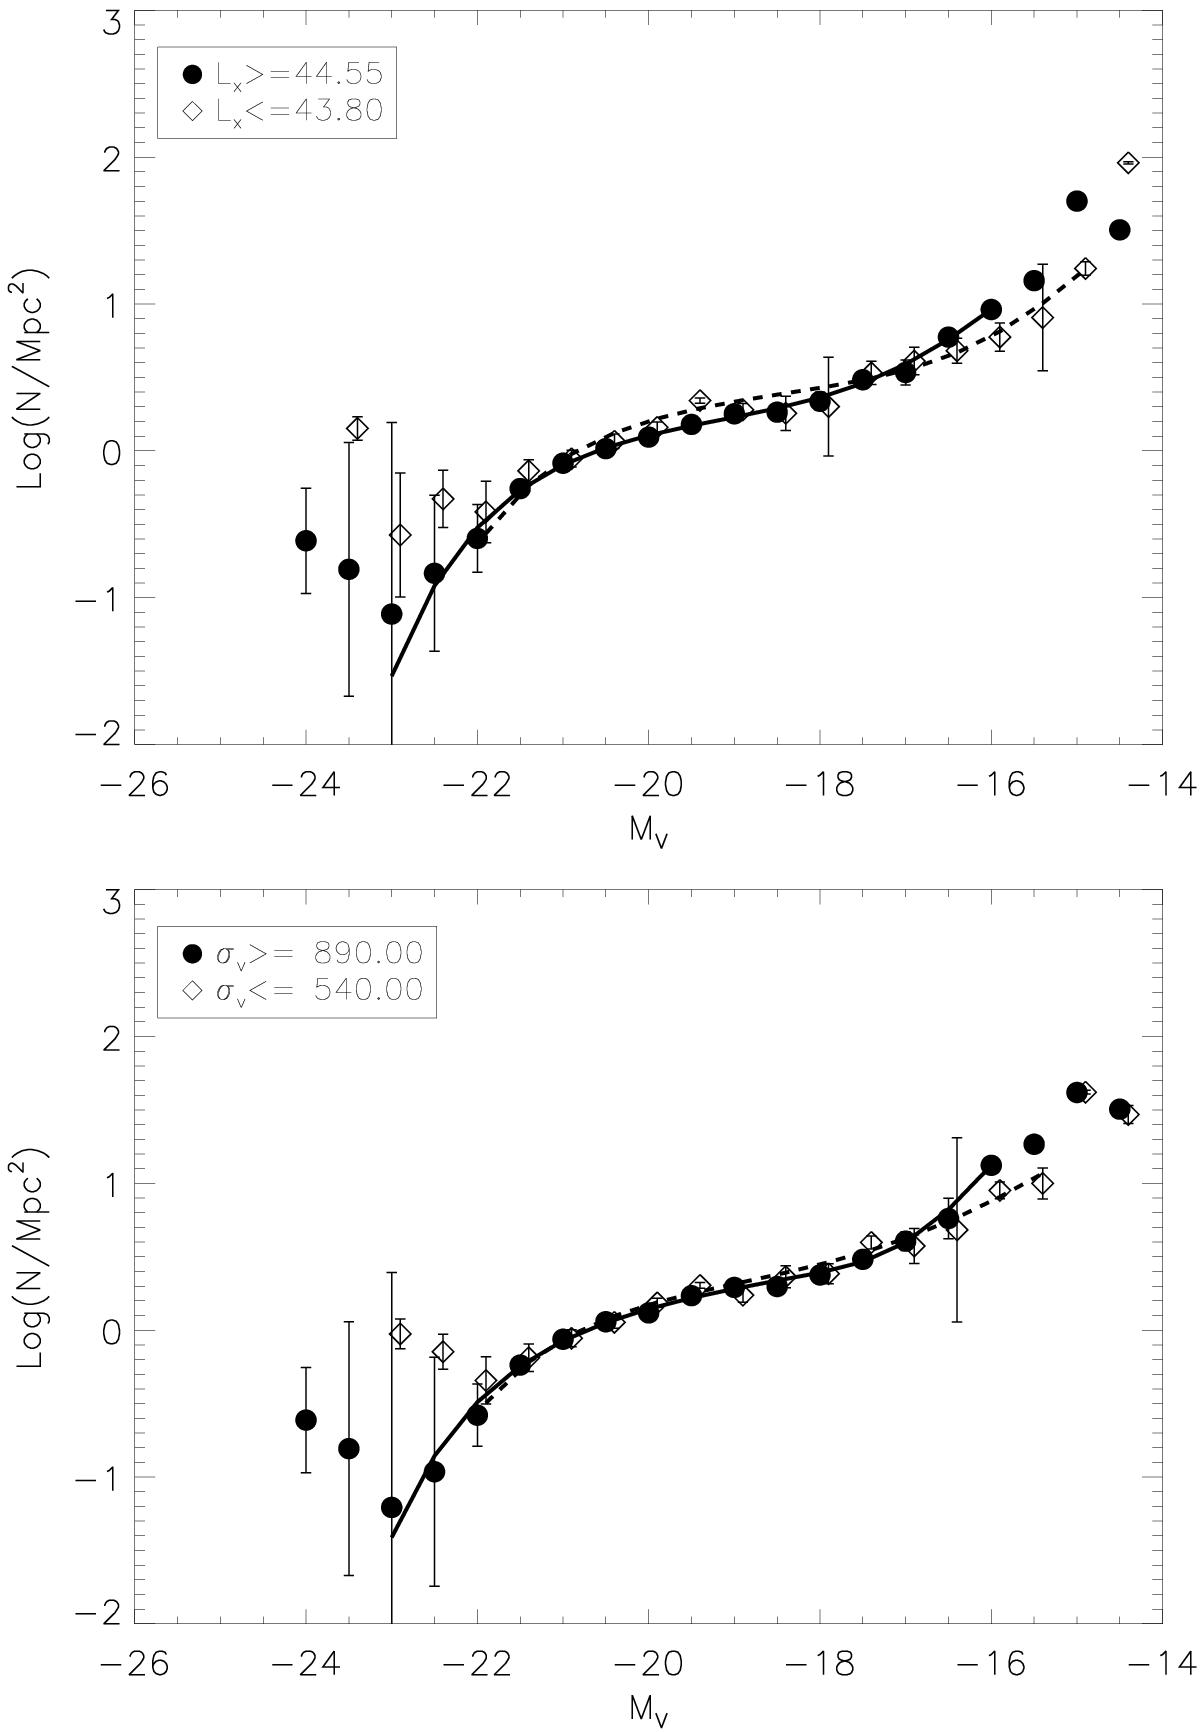
Composite LF of galaxies belonging to the ten clusters with highest (and lowest) X-ray luminosities in the upper panel, and to the ten clusters with the highest (and lowest) velocity dispersions in the lower panel. The fits are drawn with a continuous line for the highest X-ray luminosity (velocity dispersion) samples, and with a dashed line for the lowest X-ray luminosity (velocity dispersion).
Current usage metrics show cumulative count of Article Views (full-text article views including HTML views, PDF and ePub downloads, according to the available data) and Abstracts Views on Vision4Press platform.
Data correspond to usage on the plateform after 2015. The current usage metrics is available 48-96 hours after online publication and is updated daily on week days.
Initial download of the metrics may take a while.