Free Access
Fig. 2
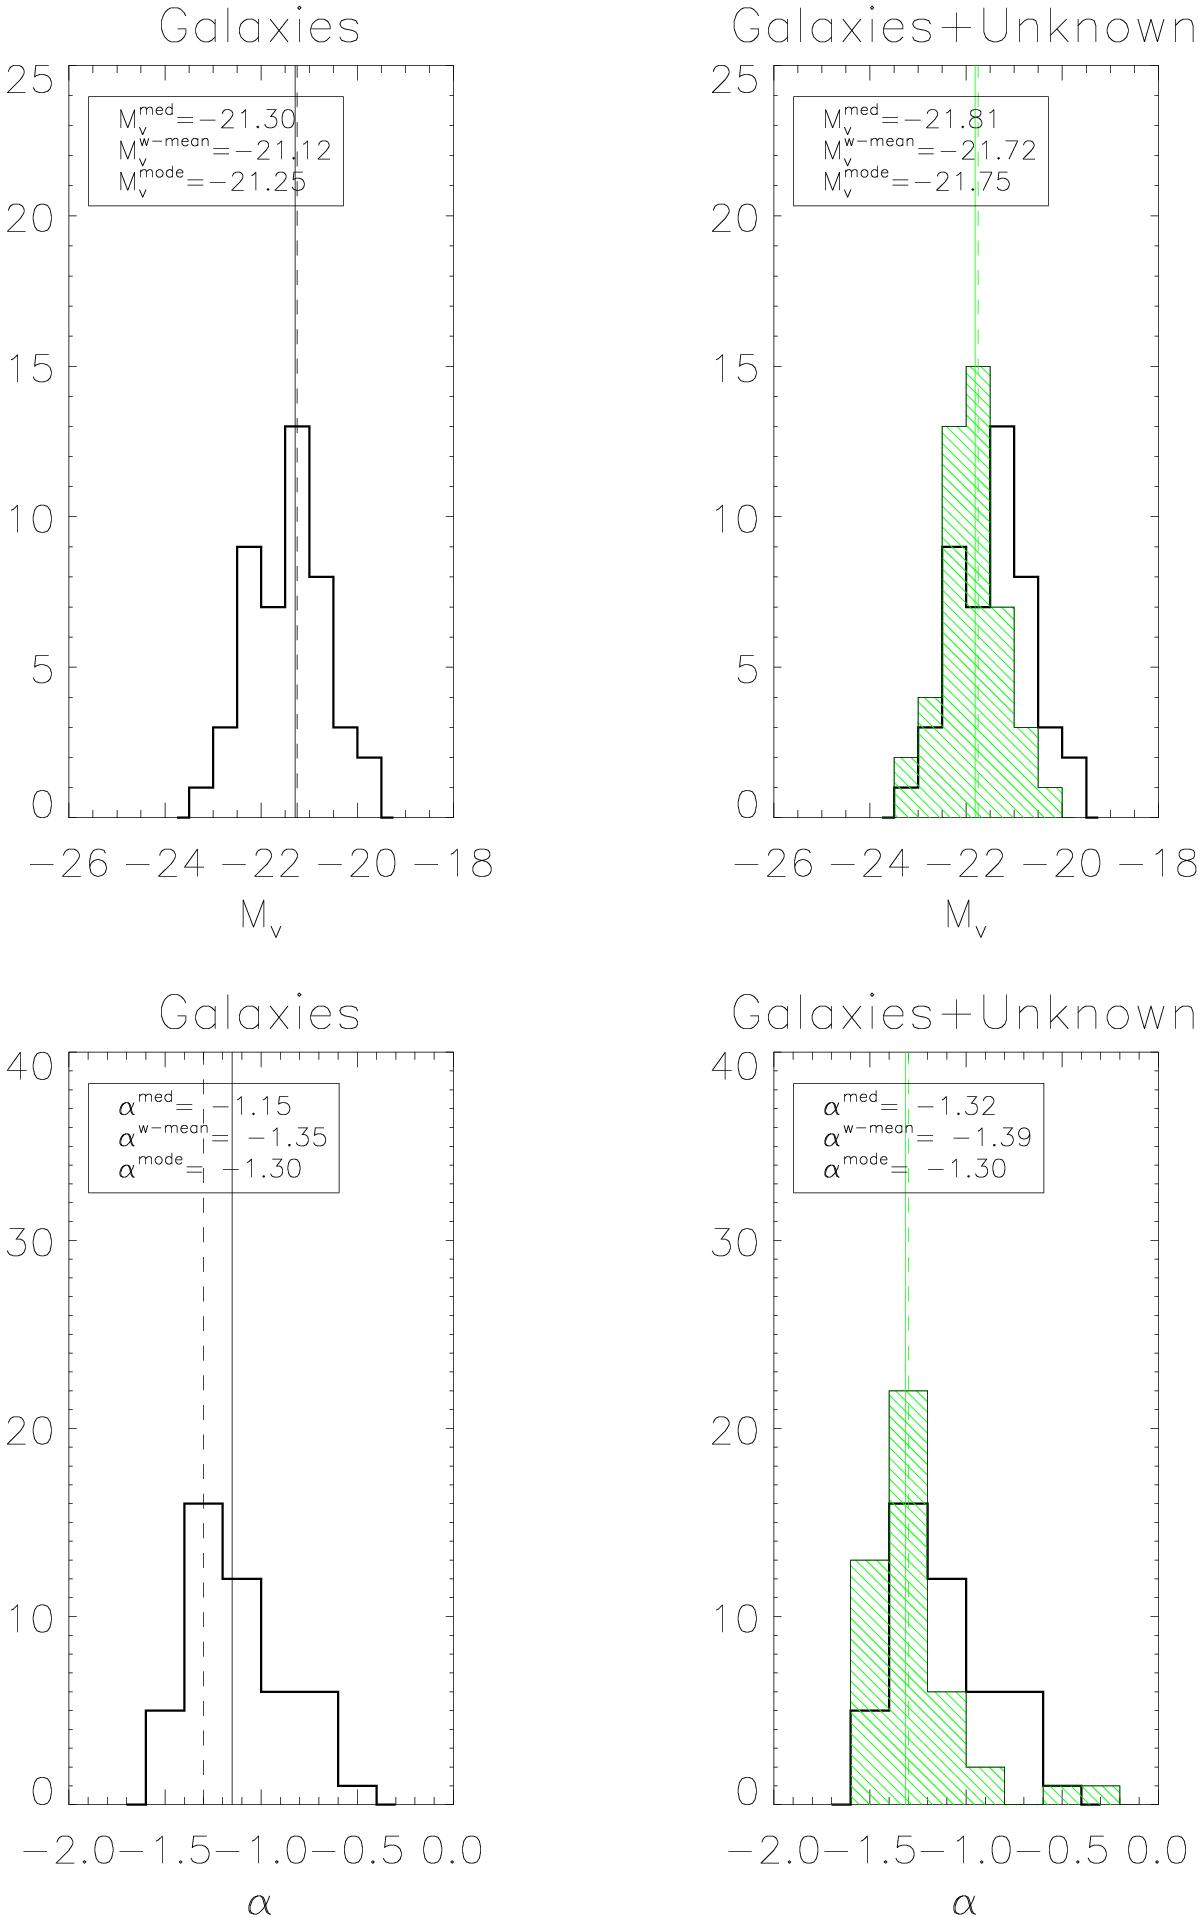
Distribution of ![]() (upper panels) and α (lower panels) derived by fitting one single Schechter function to our LF. In all plots the black histogram shows the results we obtained only analyzing objects classified as galaxies, while green histogram shows the population of galaxies and unknown objects.
(upper panels) and α (lower panels) derived by fitting one single Schechter function to our LF. In all plots the black histogram shows the results we obtained only analyzing objects classified as galaxies, while green histogram shows the population of galaxies and unknown objects.
Current usage metrics show cumulative count of Article Views (full-text article views including HTML views, PDF and ePub downloads, according to the available data) and Abstracts Views on Vision4Press platform.
Data correspond to usage on the plateform after 2015. The current usage metrics is available 48-96 hours after online publication and is updated daily on week days.
Initial download of the metrics may take a while.