Fig. 10
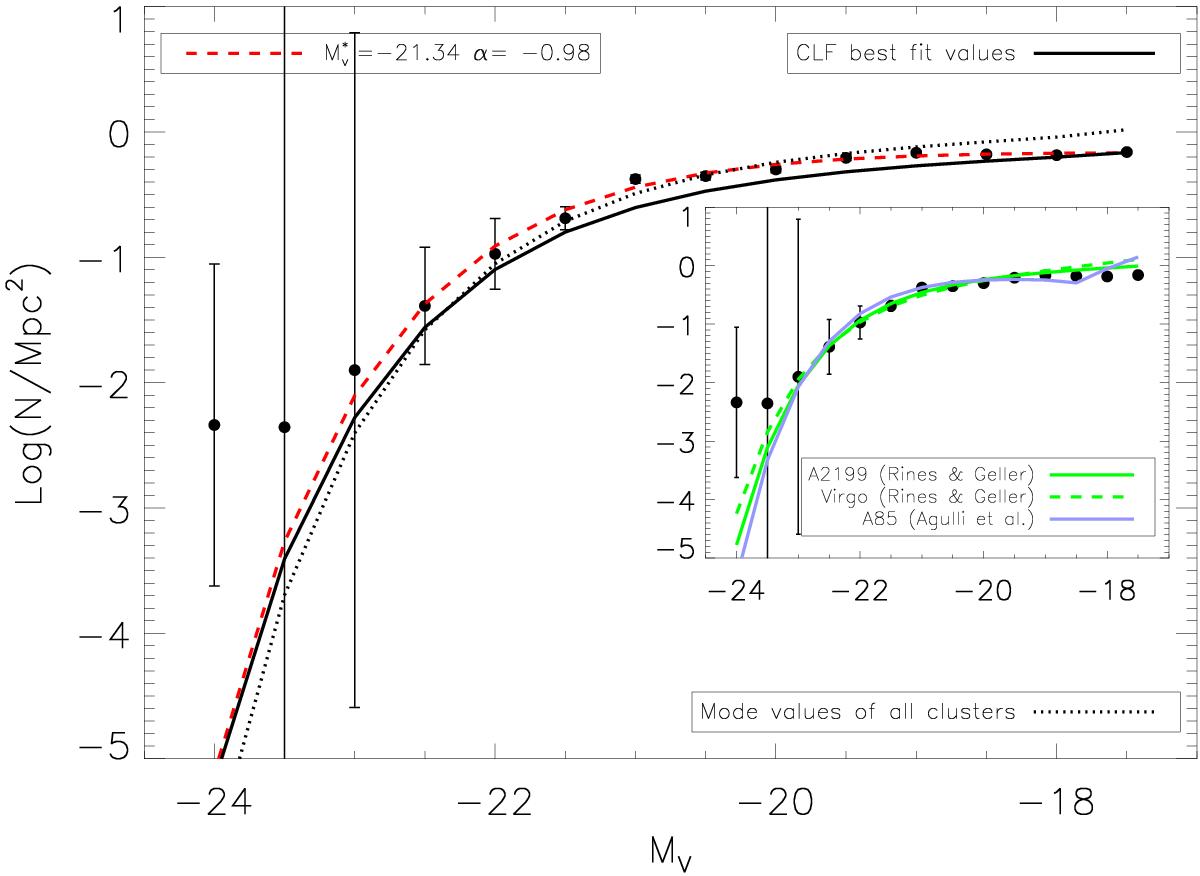
Spectroscopic LF of WINGS cluster members. The single Schechter fit to the SLF is drawn in red, while black lines represent the fit to the photometric LF (continuous line), and the Schechter function obtained using the median values of the whole sample (dotted line). In the inset we compare our SLF with those by Rines & Geller (2008) for Virgo and A2199, and by Agulli et al. (2014) for A85.
Current usage metrics show cumulative count of Article Views (full-text article views including HTML views, PDF and ePub downloads, according to the available data) and Abstracts Views on Vision4Press platform.
Data correspond to usage on the plateform after 2015. The current usage metrics is available 48-96 hours after online publication and is updated daily on week days.
Initial download of the metrics may take a while.