Fig. 1
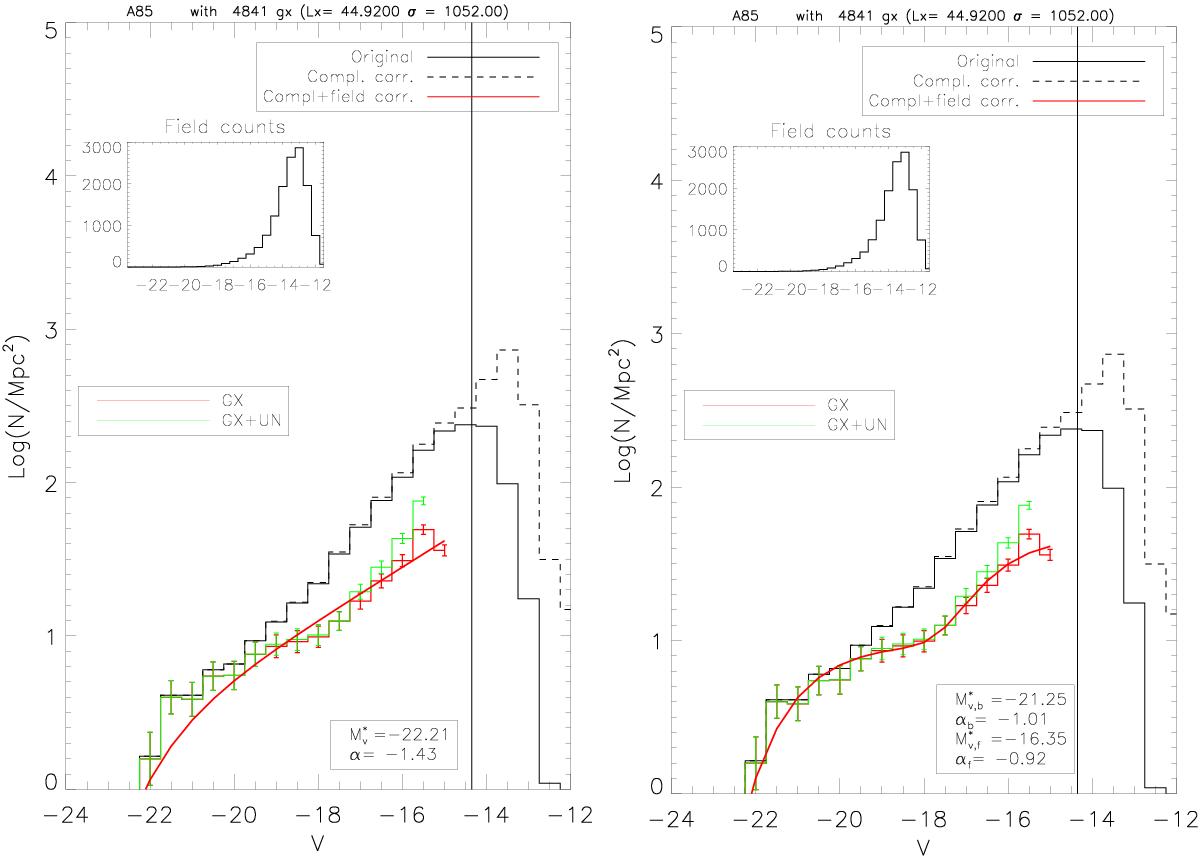
LF for the cluster A85: the black continuous line is the original LF, the dashed line is the same LF corrected for completeness. The vertical line shows the magnitude limit (different for each cluster) at which the completeness is 90%. In red and green we show the LF of the two subsamples of galaxies and galaxies and unknown object, respectively. These two last distributions have been corrected for field contamination (whose number counts are shown in the inset). Superimposed on the red LF is the best fit that we obtained using a single Schechter function (left panel) and a double Schechter function (right panel). In the bottom right insets we give the relative parameters.
Current usage metrics show cumulative count of Article Views (full-text article views including HTML views, PDF and ePub downloads, according to the available data) and Abstracts Views on Vision4Press platform.
Data correspond to usage on the plateform after 2015. The current usage metrics is available 48-96 hours after online publication and is updated daily on week days.
Initial download of the metrics may take a while.