Fig. 5
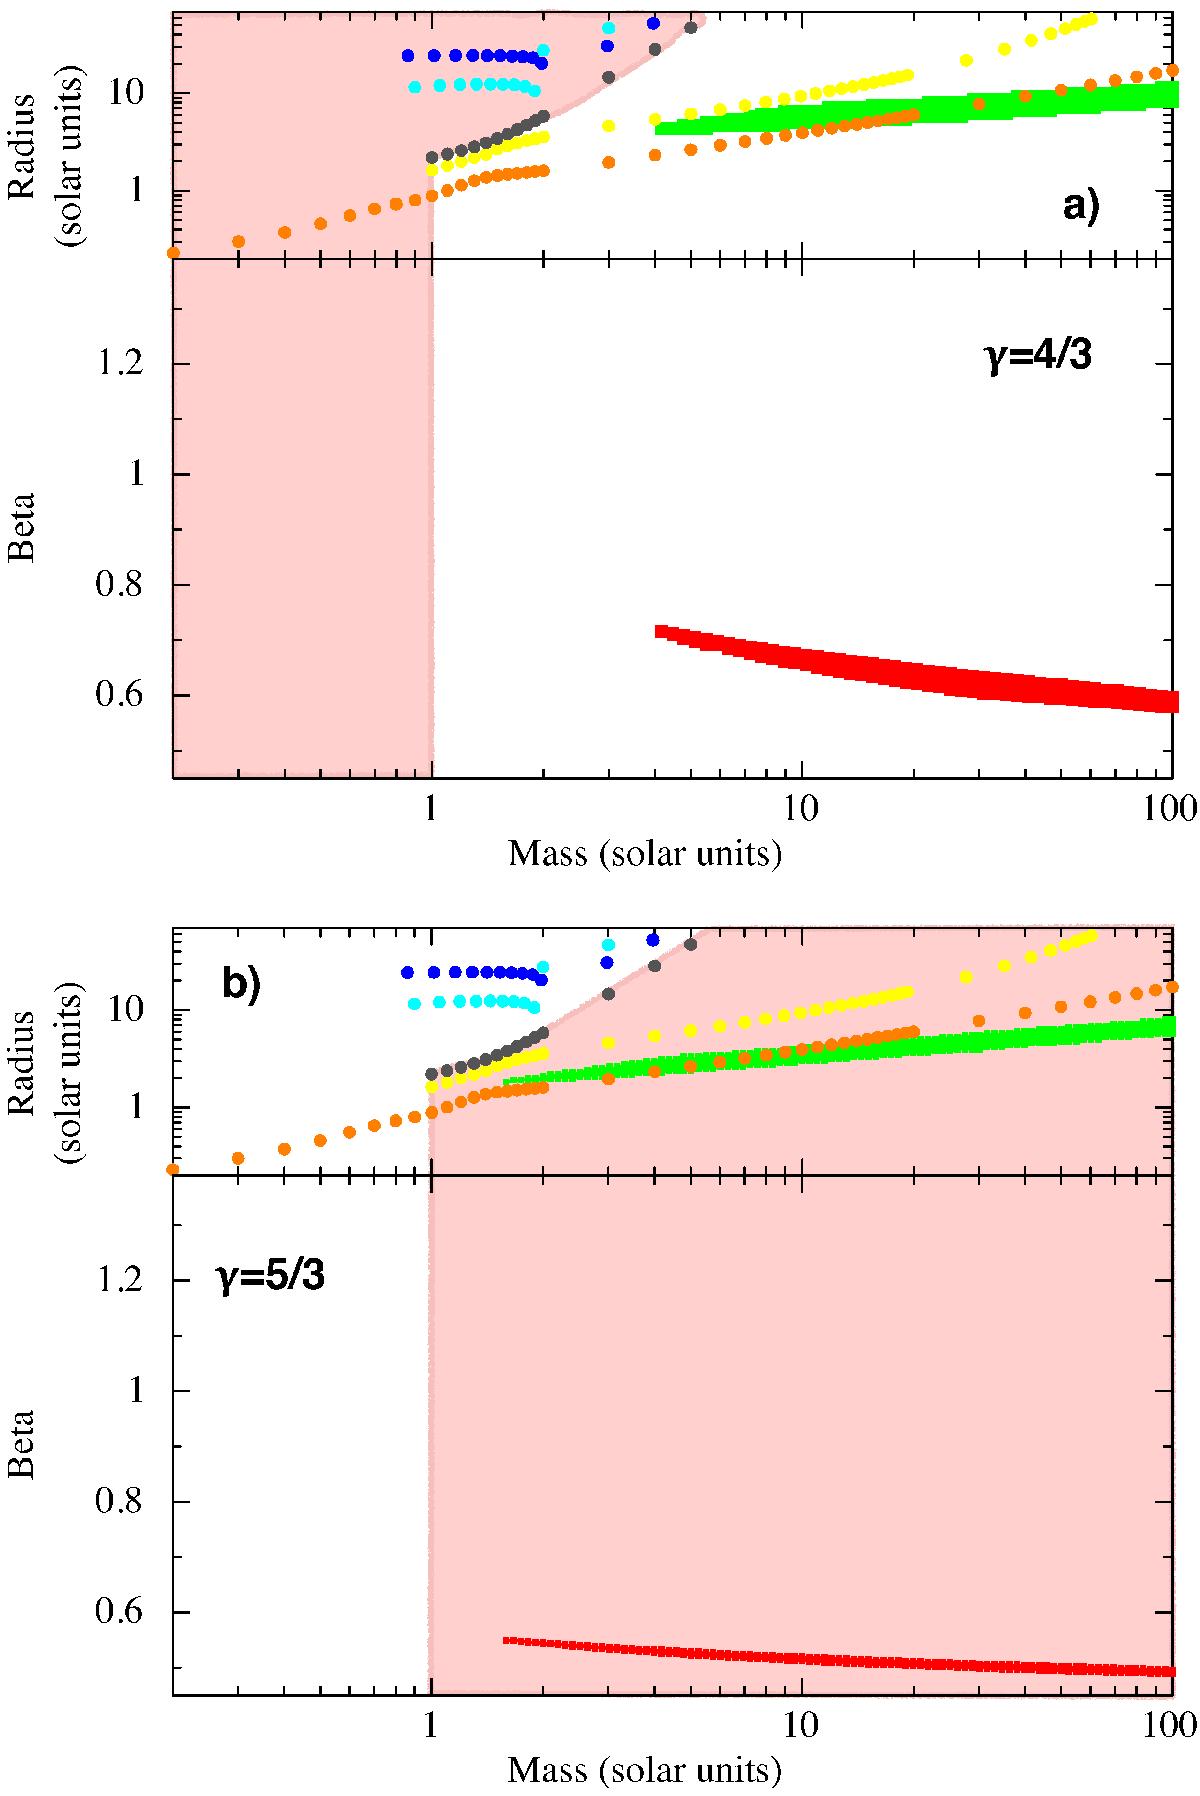
Radius of the orbiting star and impact parameter β = rt/rp as a function of the stellar mass. The allowed regions were computed based on fitting formulae in Guillochon & Ramirez-Ruiz (2013 and related errata corrige). Upper panel: orbiting stars characterised by a polytropic index γ = 4/3. The red region in the lower panel shows the allowed β parameters. The light red region approximately excludes the low-mass end (≲1 M⊙) and the stars more evolved than the giant branch because they are not well described by a polytropic index γ = 4/3. Orange dots indicate stars in the main -sequence phase, yellow dots the Hertzsprung gap, black dots the giant branch, light blue dots the helium core-burning, and blue dots the asymptotic giant branch phase. Lower panel: polytropic star with index γ = 5/3. Colours, dots, and regions are as above. The light red region approximately excludes the high-mass end (≳1 M⊙), because these stars are not well described by a polytropic index γ = 5/3 (but includes evolved giant stars). No acceptable solutions remain for this case.
Current usage metrics show cumulative count of Article Views (full-text article views including HTML views, PDF and ePub downloads, according to the available data) and Abstracts Views on Vision4Press platform.
Data correspond to usage on the plateform after 2015. The current usage metrics is available 48-96 hours after online publication and is updated daily on week days.
Initial download of the metrics may take a while.