Fig. 4
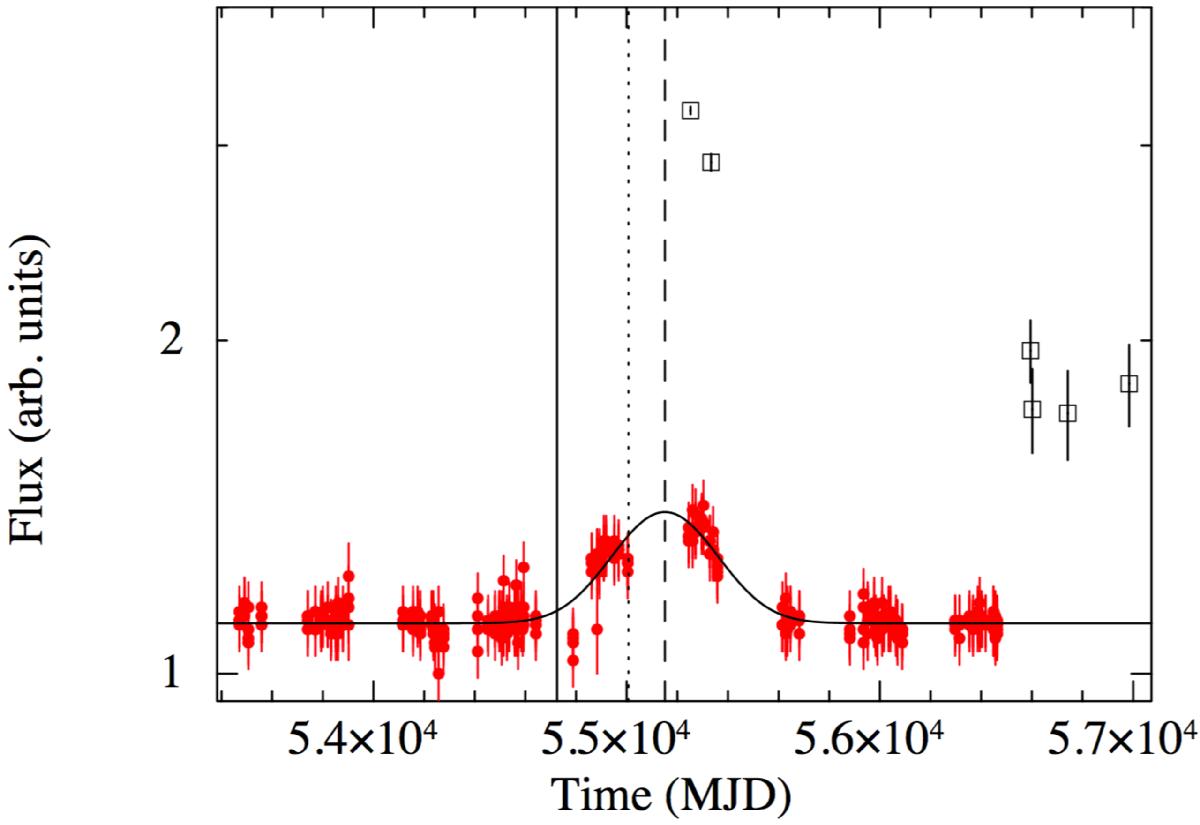
Optical (flux) light curve of IC 3599 from the Catalina sky survey in arbitrary units (red dots), together with the Swift/XRT light curve (open squares) converted into flux using the spectral fit model, in arbitrary units. The Gaussian fit refers to the optical data. The vertical dashed line marks the time (MJD) of the optical peak, the dotted line the peak of the X-ray flux according to the multi-peak modelling. The continuous line marks the time at which the optical light curve rises by 10% from the quiescent level.
Current usage metrics show cumulative count of Article Views (full-text article views including HTML views, PDF and ePub downloads, according to the available data) and Abstracts Views on Vision4Press platform.
Data correspond to usage on the plateform after 2015. The current usage metrics is available 48-96 hours after online publication and is updated daily on week days.
Initial download of the metrics may take a while.