Fig. 3
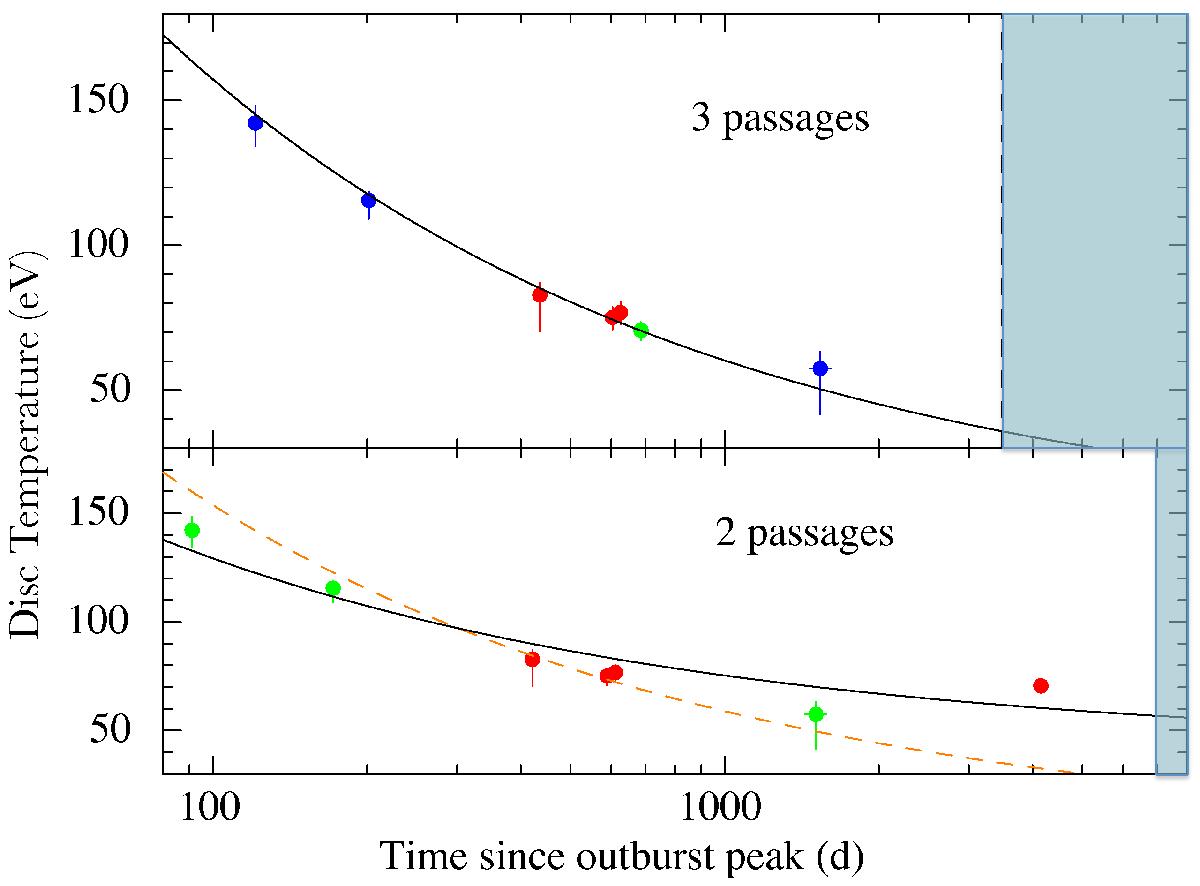
Upper panel: disc temperatures as derived from the spectral fits folded on a three-passages light curve. Error bars are at 1σ confidence level. Red points (ROSAT) refer to the first passage, the green point (Chandra) to the second passage, and blue points (Swift) to the third. Disc temperature evolution is fitted with a fixed T ∝ t− 5/12 power law (deriving from Ṁ ∝ t− 5/3 and T ∝ Ṁ1/4 typical of an accretion disc and therefore being a direct test for the disc cooling, Lodato & Rossi 2010). Lower panel: as above, but for two passages. Red dots (ROSAT and Chandra) refer to the first passage and green dots (Swift) to the second. The fit with a T ∝ t− 5/12 power law is shown as a dashed orange line.
Current usage metrics show cumulative count of Article Views (full-text article views including HTML views, PDF and ePub downloads, according to the available data) and Abstracts Views on Vision4Press platform.
Data correspond to usage on the plateform after 2015. The current usage metrics is available 48-96 hours after online publication and is updated daily on week days.
Initial download of the metrics may take a while.