Fig. 1
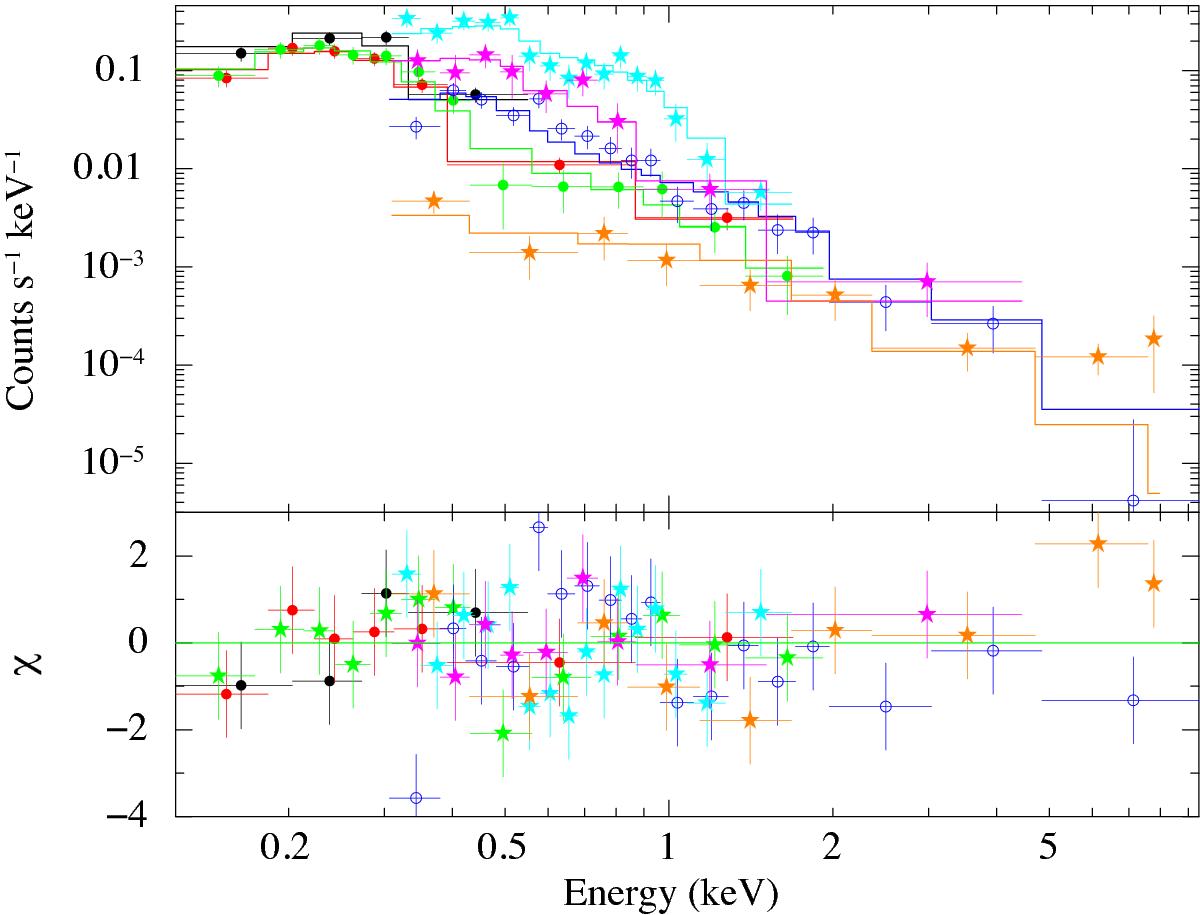
X-ray spectra fitted with the absorbed disc black body plus power-law model described in the text. Data were rebinned to reach a 5σ significance or by a factor of 5 for plotting purposes. In the upper panel black, red, and green (filled circles) data refer to ROSAT spectra (first, second, and third observations, respectively). Blue (open circles) data refer to the Chandra spectrum. Light blue, magenta, and orange (filled stars) to Swift spectra (first, second, and third observations, respectively). In the lower panel residuals in terms of χ are plotted with the same colour codings and symbols.
Current usage metrics show cumulative count of Article Views (full-text article views including HTML views, PDF and ePub downloads, according to the available data) and Abstracts Views on Vision4Press platform.
Data correspond to usage on the plateform after 2015. The current usage metrics is available 48-96 hours after online publication and is updated daily on week days.
Initial download of the metrics may take a while.