Fig. 7
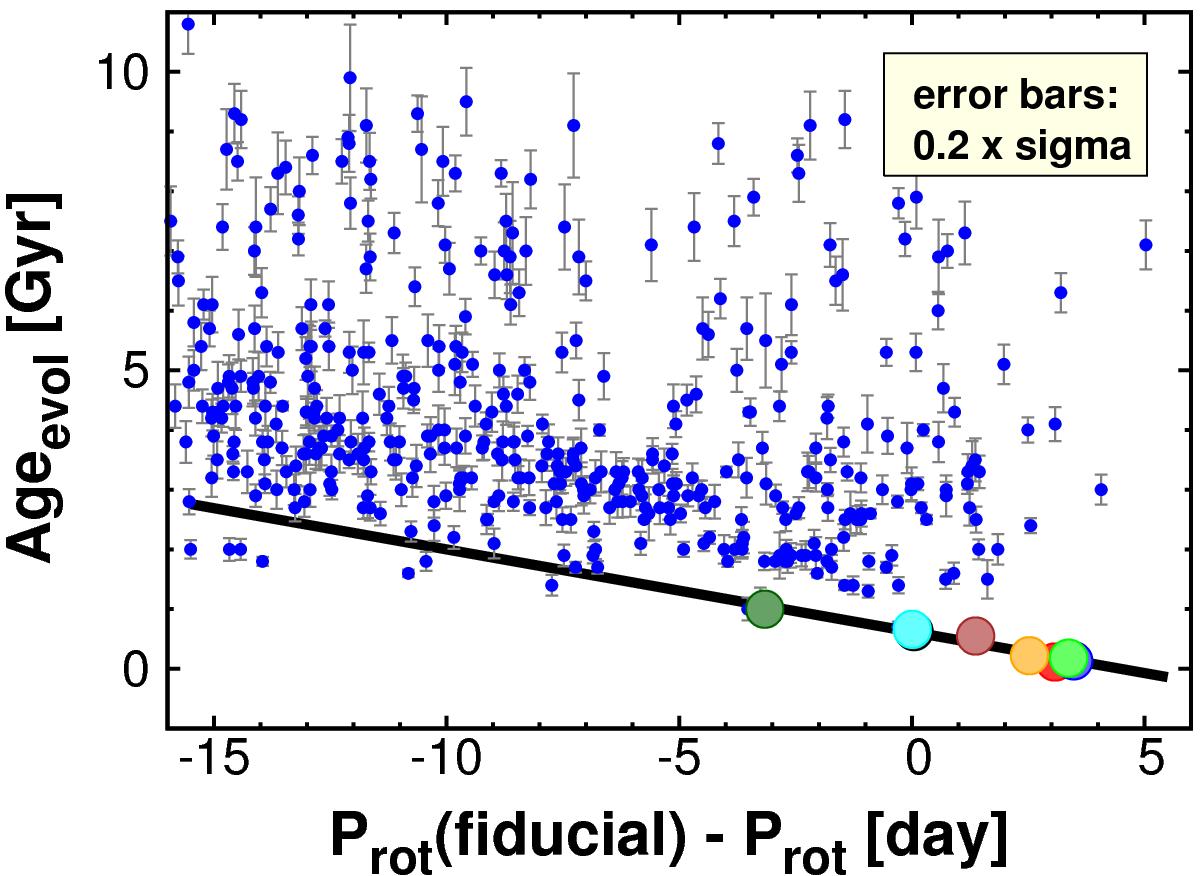
Period shift vs. evolutionary (i.e., isochrone) ages for the field star sample of Valenti & Fisher (2005; blue dots) and for the eight open cluster ridges as presented in this paper (large colored dots). The linear regression to the cluster data is shown by the black line.
Current usage metrics show cumulative count of Article Views (full-text article views including HTML views, PDF and ePub downloads, according to the available data) and Abstracts Views on Vision4Press platform.
Data correspond to usage on the plateform after 2015. The current usage metrics is available 48-96 hours after online publication and is updated daily on week days.
Initial download of the metrics may take a while.