Fig. 4
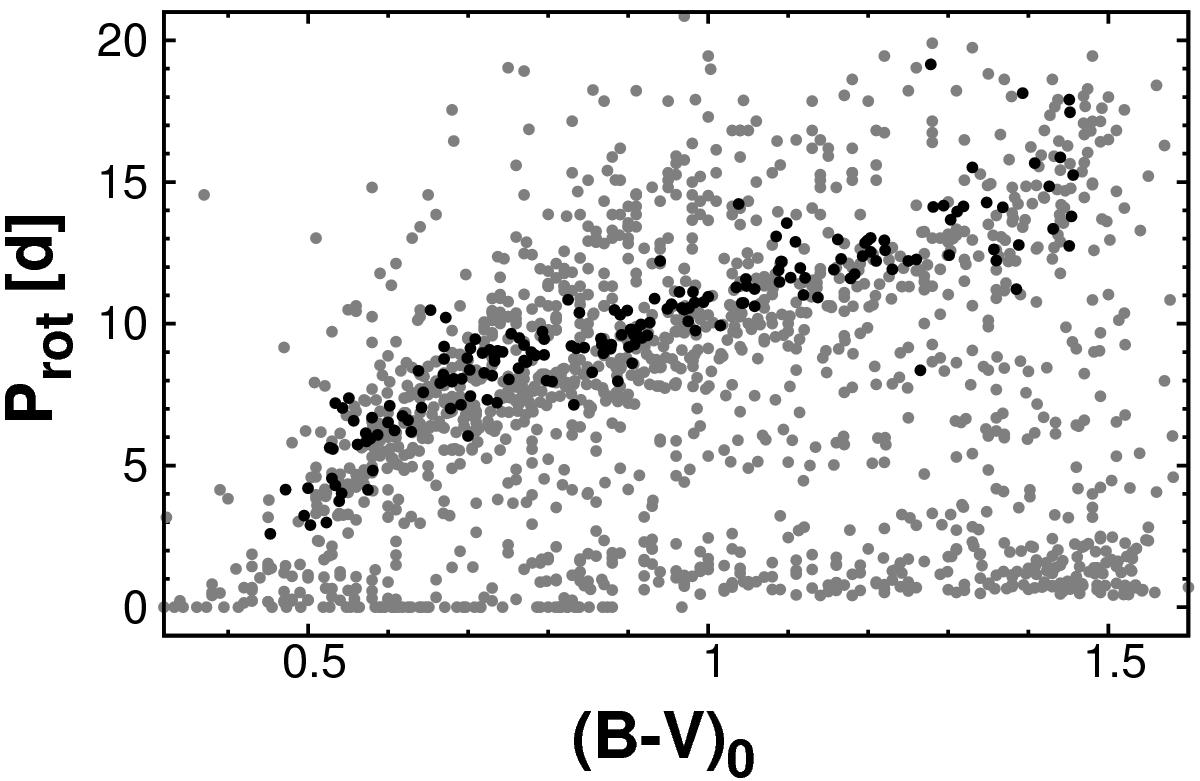
Merged data of the eight clusters after multiplying the cluster periods by the factors given by the exact Skumanich-law (i.e., ![]() .) The cluster ages are given in Table 1. Data from M 44 (Praesepe) are shown by black dots.
.) The cluster ages are given in Table 1. Data from M 44 (Praesepe) are shown by black dots.
Current usage metrics show cumulative count of Article Views (full-text article views including HTML views, PDF and ePub downloads, according to the available data) and Abstracts Views on Vision4Press platform.
Data correspond to usage on the plateform after 2015. The current usage metrics is available 48-96 hours after online publication and is updated daily on week days.
Initial download of the metrics may take a while.