Fig. 1
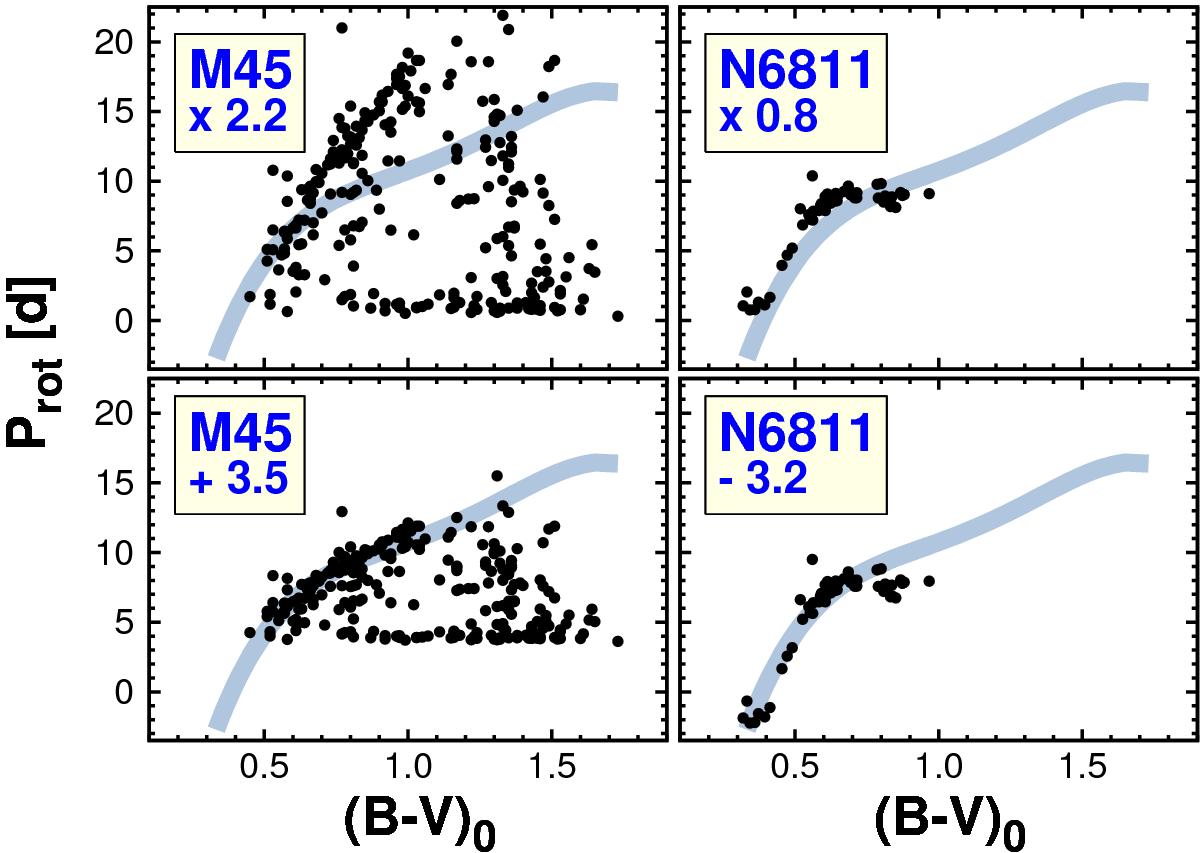
Multiplicative vs. additive ridge alignments. The upper panels show the result of the exact Skumanich-type period scaling with ![]() , where t stands for cluster ages. The scaling factors are displayed in the boxes. The lower panels show the same test with the additive scaling of Prot → Prot + c, where c is the period shift as shown in the corresponding boxes. The fiducial ridge (see Eq. (3)) is plotted as a light color continuous line.
, where t stands for cluster ages. The scaling factors are displayed in the boxes. The lower panels show the same test with the additive scaling of Prot → Prot + c, where c is the period shift as shown in the corresponding boxes. The fiducial ridge (see Eq. (3)) is plotted as a light color continuous line.
Current usage metrics show cumulative count of Article Views (full-text article views including HTML views, PDF and ePub downloads, according to the available data) and Abstracts Views on Vision4Press platform.
Data correspond to usage on the plateform after 2015. The current usage metrics is available 48-96 hours after online publication and is updated daily on week days.
Initial download of the metrics may take a while.