Fig. 1
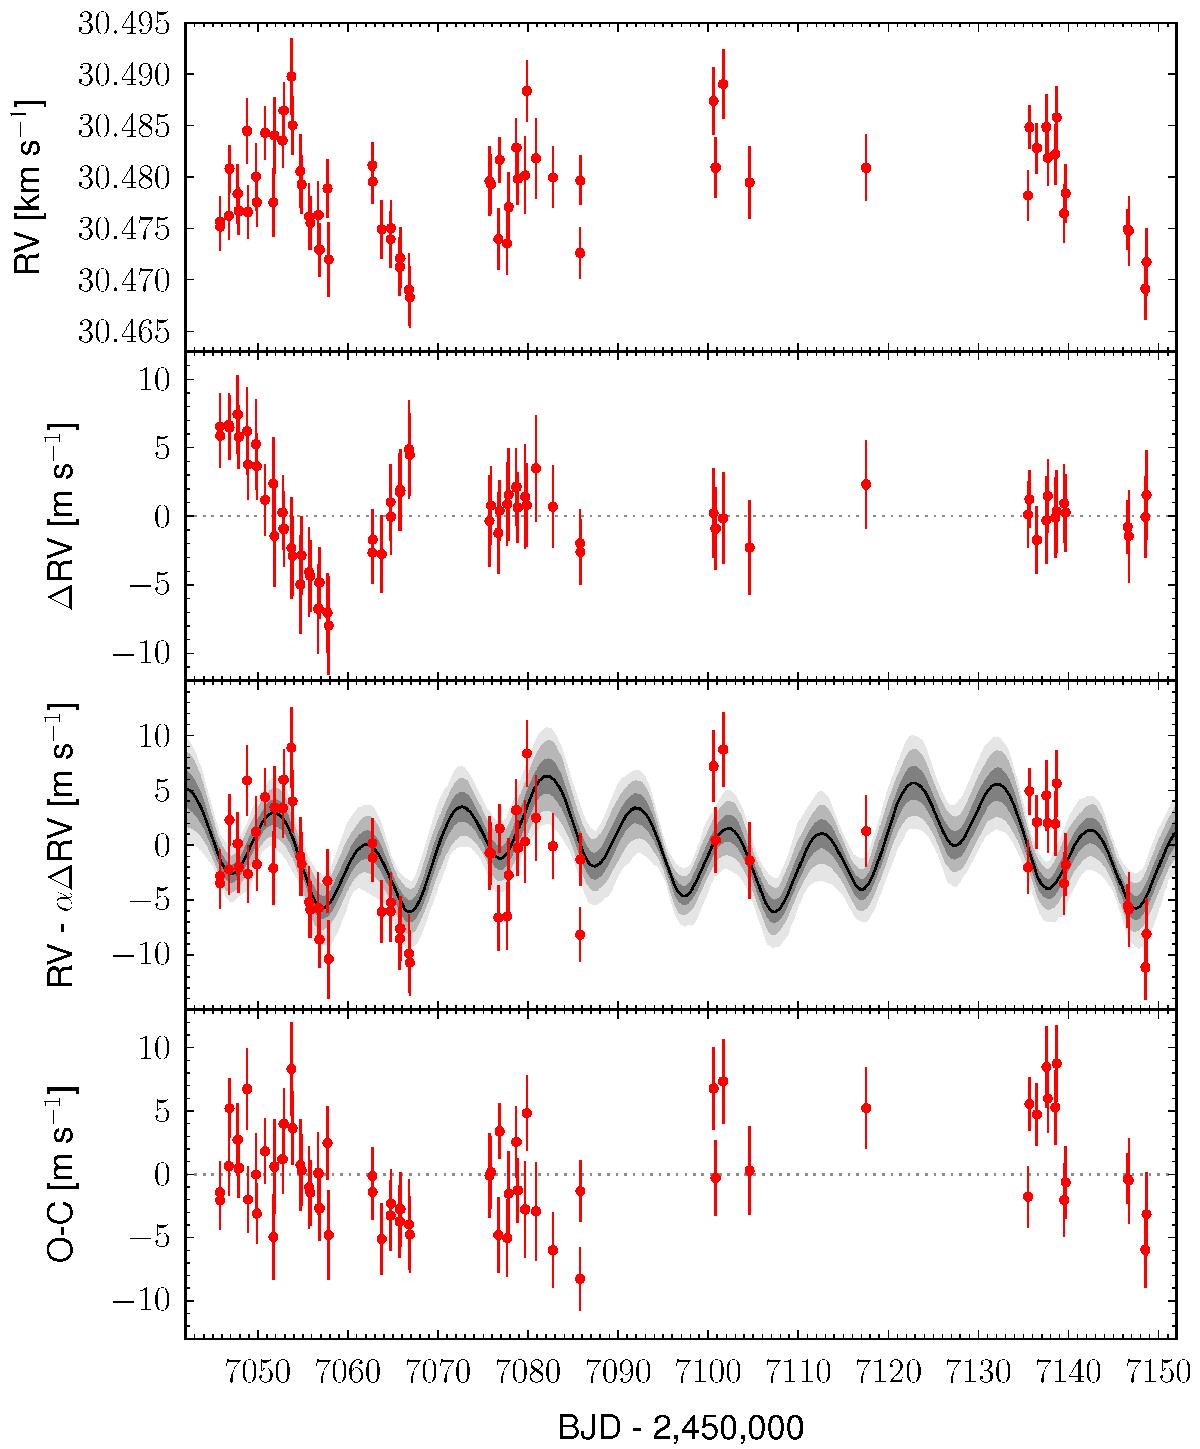
Time series for, from top to bottom: a) the HARPS RVs of K2-3; b) ΔRV (Sect. 2.3); c) the RVs corrected from the αΔRV of the maximum likelihood model together with the dynamical model (the solid black line represents the median model, and the shades of grey represent the 68.3, 95.5, and 99.7% Bayesian confidence intervals); and d) the RV residual from the maximum likelihood dynamical model.
Current usage metrics show cumulative count of Article Views (full-text article views including HTML views, PDF and ePub downloads, according to the available data) and Abstracts Views on Vision4Press platform.
Data correspond to usage on the plateform after 2015. The current usage metrics is available 48-96 hours after online publication and is updated daily on week days.
Initial download of the metrics may take a while.