Fig. 3
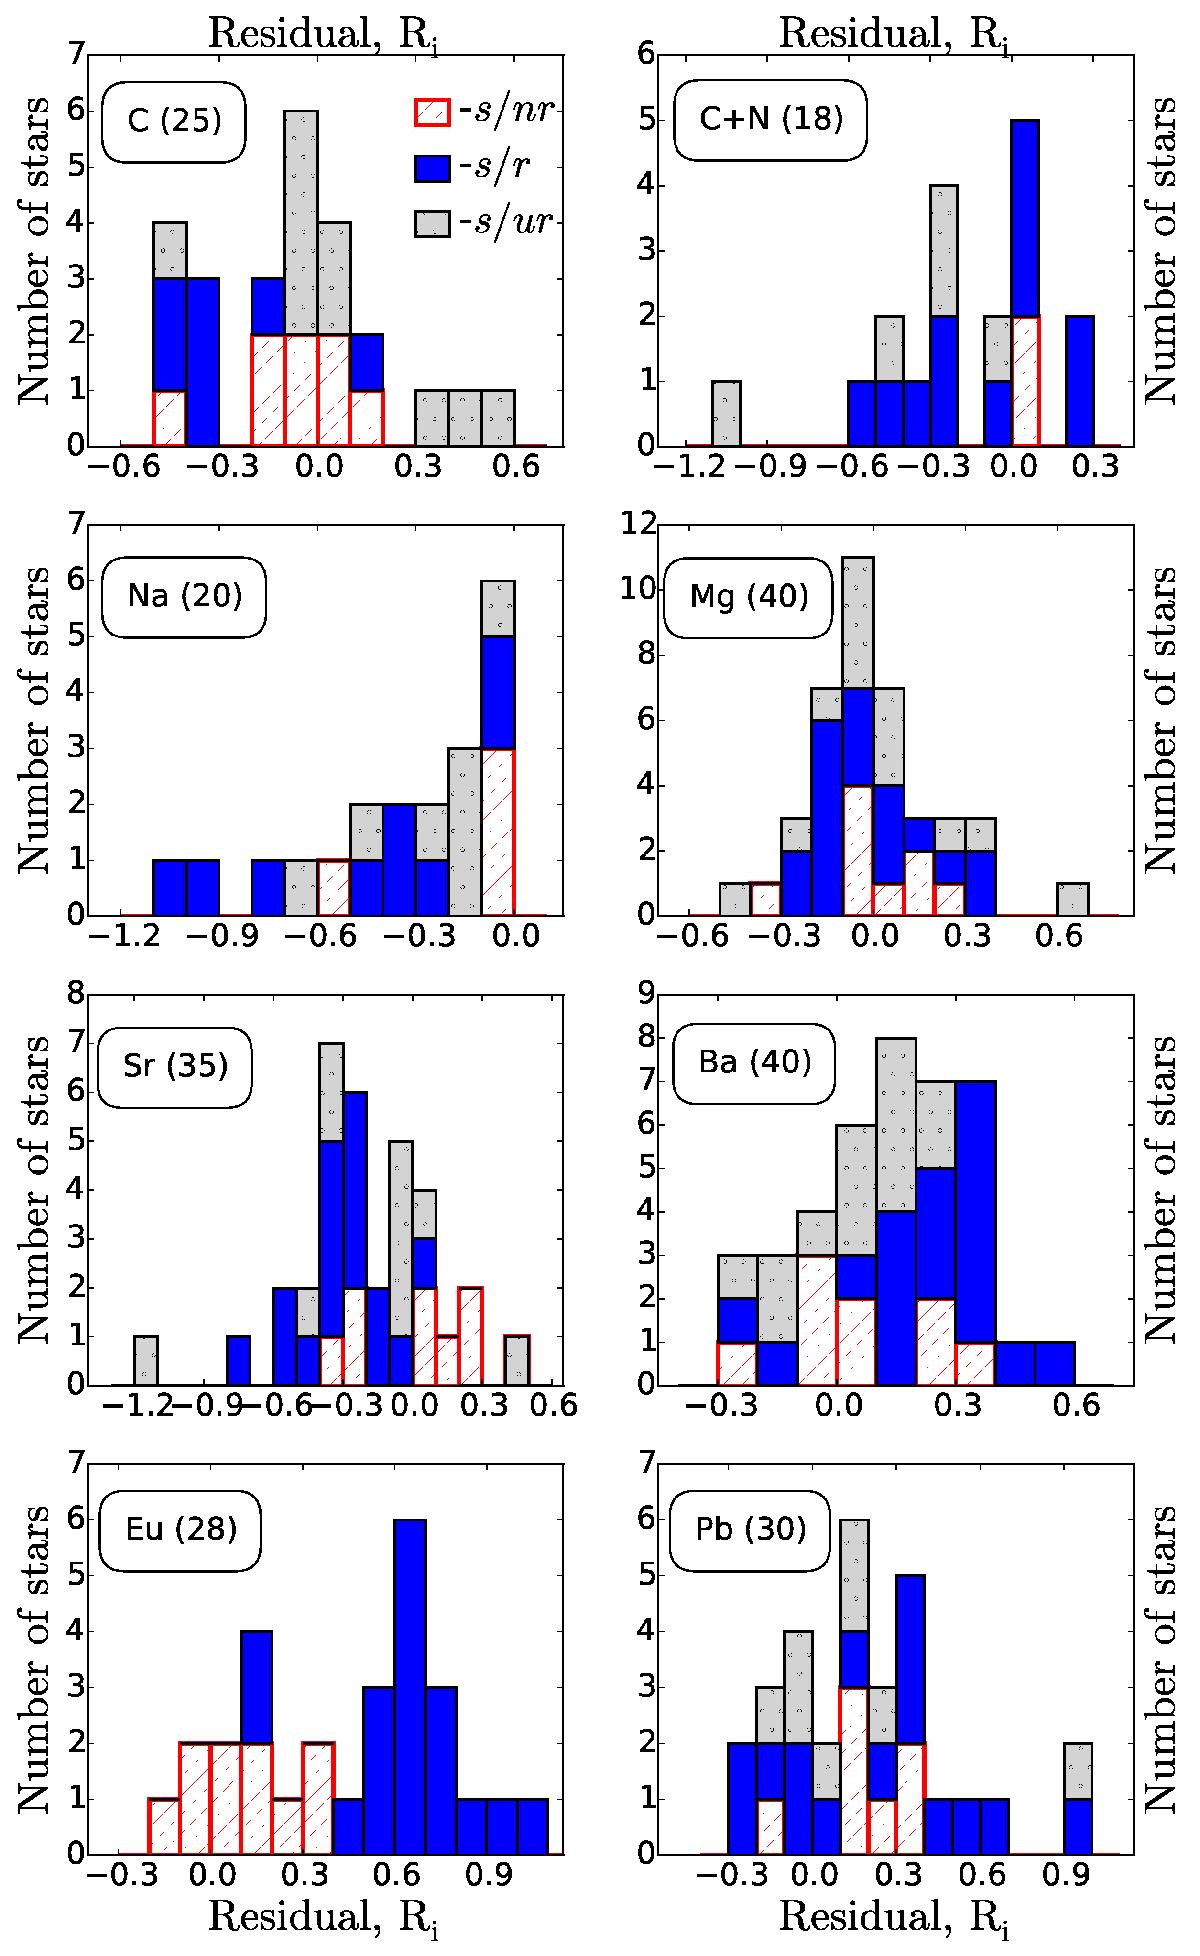
Residual distributions in the model-A CEMP-s stars of our sample with ν ≥ 2. The number of stars in which the element is measured is indicated in brackets. The red-hatched, blue-filled and grey-dotted histograms indicate the residual distributions for CEMP-s/nr, CEMP-s/r and CEMP-s/ur stars, respectively. In the top-left panel the residual distribution of carbon is shown for those stars without a nitrogen measurement.
Current usage metrics show cumulative count of Article Views (full-text article views including HTML views, PDF and ePub downloads, according to the available data) and Abstracts Views on Vision4Press platform.
Data correspond to usage on the plateform after 2015. The current usage metrics is available 48-96 hours after online publication and is updated daily on week days.
Initial download of the metrics may take a while.