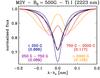
Fig. 9
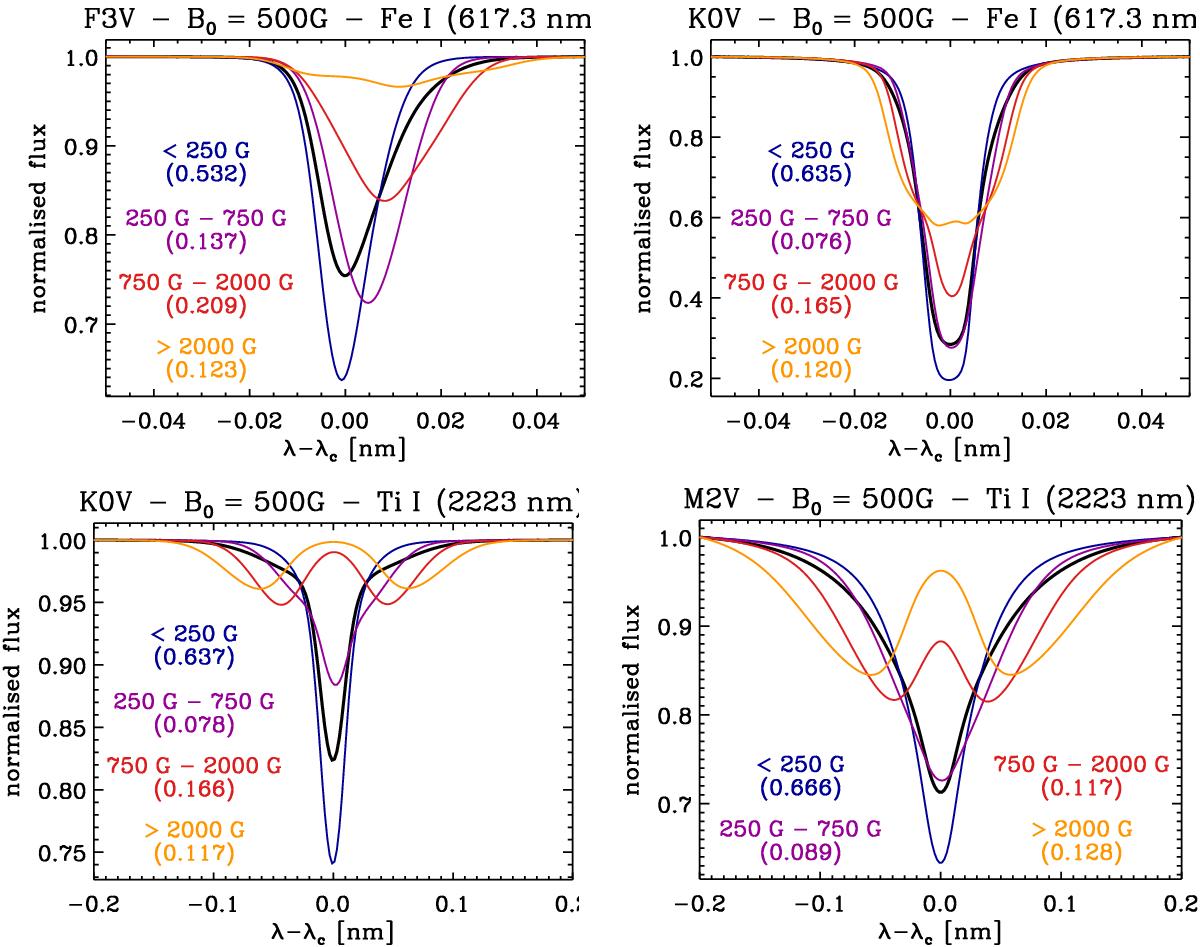
Decomposition of four line profiles (at μ = 1) into differently magnetised components. The black curve shows the average line profile, while the coloured curves show the line averaged over areas where B(τR = 1) is in the specified ranges. Each line is normalised to its own continuum. The numbers in parentheses give the weight of the components in the composite spectrum (i.e. average continuum flux times area fraction).
Current usage metrics show cumulative count of Article Views (full-text article views including HTML views, PDF and ePub downloads, according to the available data) and Abstracts Views on Vision4Press platform.
Data correspond to usage on the plateform after 2015. The current usage metrics is available 48-96 hours after online publication and is updated daily on week days.
Initial download of the metrics may take a while.