Fig. 8
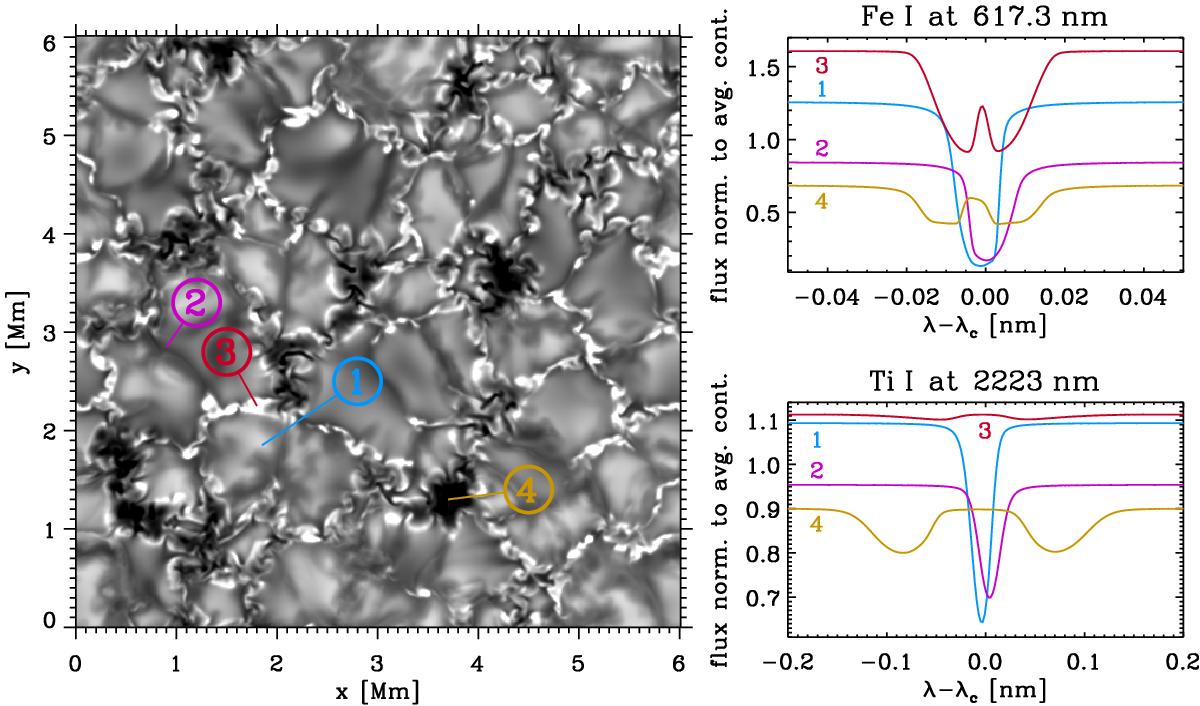
Local vertical spectral line profiles for the K0V simulation with B0 = 500 G. Left panel: intensity image with four positions marked. Right panels: local profiles of the Fe i line at 617.3 nm (top) and the Ti i line at 2223 nm (bottom) at (μ = 1); the four different colours correspond to the four points marked in the left panel.
Current usage metrics show cumulative count of Article Views (full-text article views including HTML views, PDF and ePub downloads, according to the available data) and Abstracts Views on Vision4Press platform.
Data correspond to usage on the plateform after 2015. The current usage metrics is available 48-96 hours after online publication and is updated daily on week days.
Initial download of the metrics may take a while.