Fig. 13
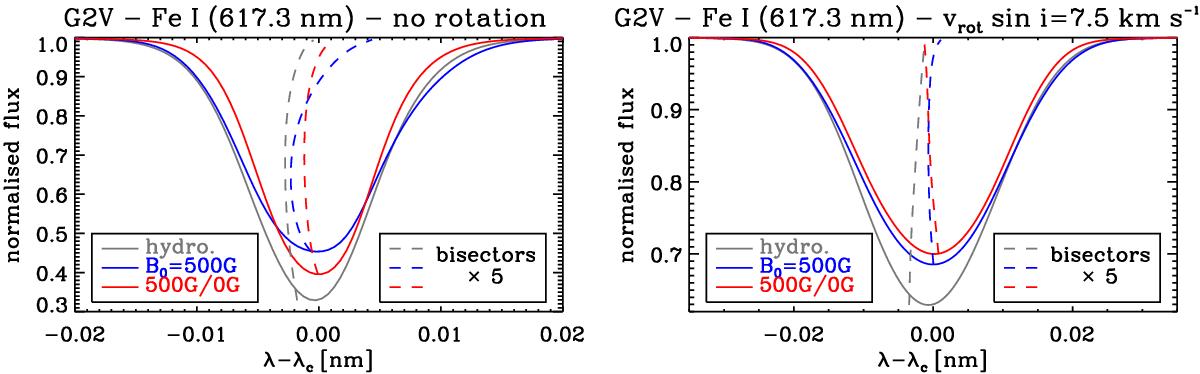
Disc-integrated profiles of the Fe i line at 617.3 nm without rotation (left) and with υrot sini = 7.5 km s-1 (differential, α = 0.2, i = 60°; right) for G2V simulations. The grey line represents the profile of the non-magnetic run (hydro.), the blue curve is the profile of the 500 G run, the red curve is calculated using the thermodynamic structure of the 500 G run but assuming B ≡ 0 G for the line calculation (see text for further explanation). Dashed curves give the bisectors of the profiles with λ−λc values magnified by a factor of 5 for clarity. We note the different scales of ordinate and abscissa.
Current usage metrics show cumulative count of Article Views (full-text article views including HTML views, PDF and ePub downloads, according to the available data) and Abstracts Views on Vision4Press platform.
Data correspond to usage on the plateform after 2015. The current usage metrics is available 48-96 hours after online publication and is updated daily on week days.
Initial download of the metrics may take a while.