Free Access
Fig. 1
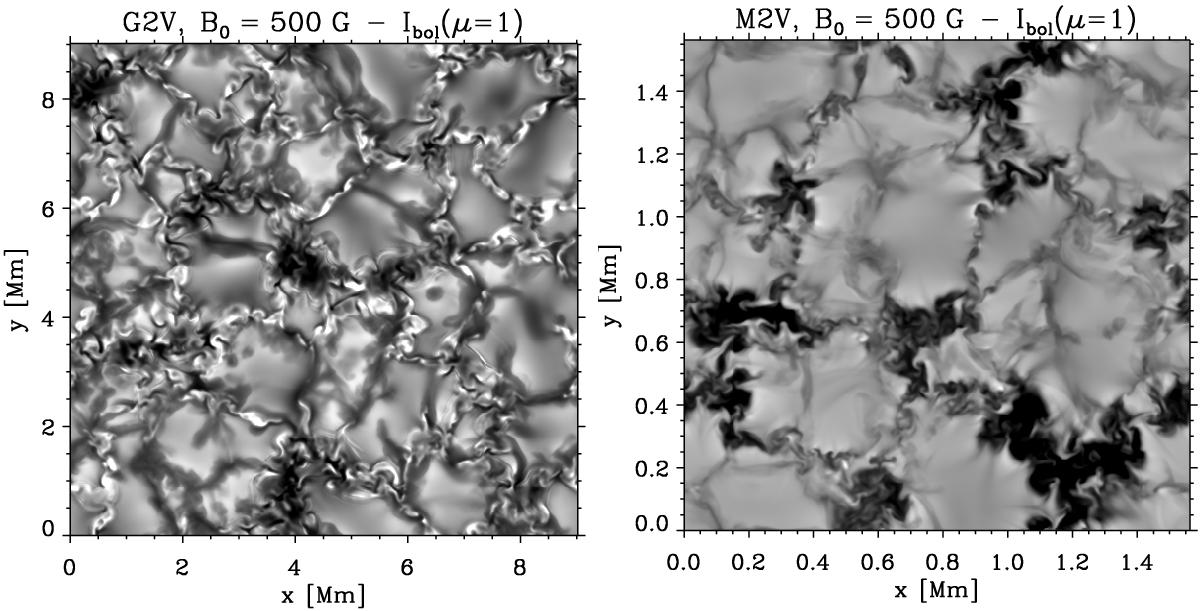
Vertically emerging bolometric intensity of a snapshot of the 500 G runs of the G2V (left) and M2V (right) simulations. The grey scale saturates at ± 2.5 standard deviations from the mean intensity. Intensity maps of further simulations are given in Paper I (Fig. 2) and Paper III (Fig. 1).
This figure is made of several images, please see below:
Current usage metrics show cumulative count of Article Views (full-text article views including HTML views, PDF and ePub downloads, according to the available data) and Abstracts Views on Vision4Press platform.
Data correspond to usage on the plateform after 2015. The current usage metrics is available 48-96 hours after online publication and is updated daily on week days.
Initial download of the metrics may take a while.