Fig. 11
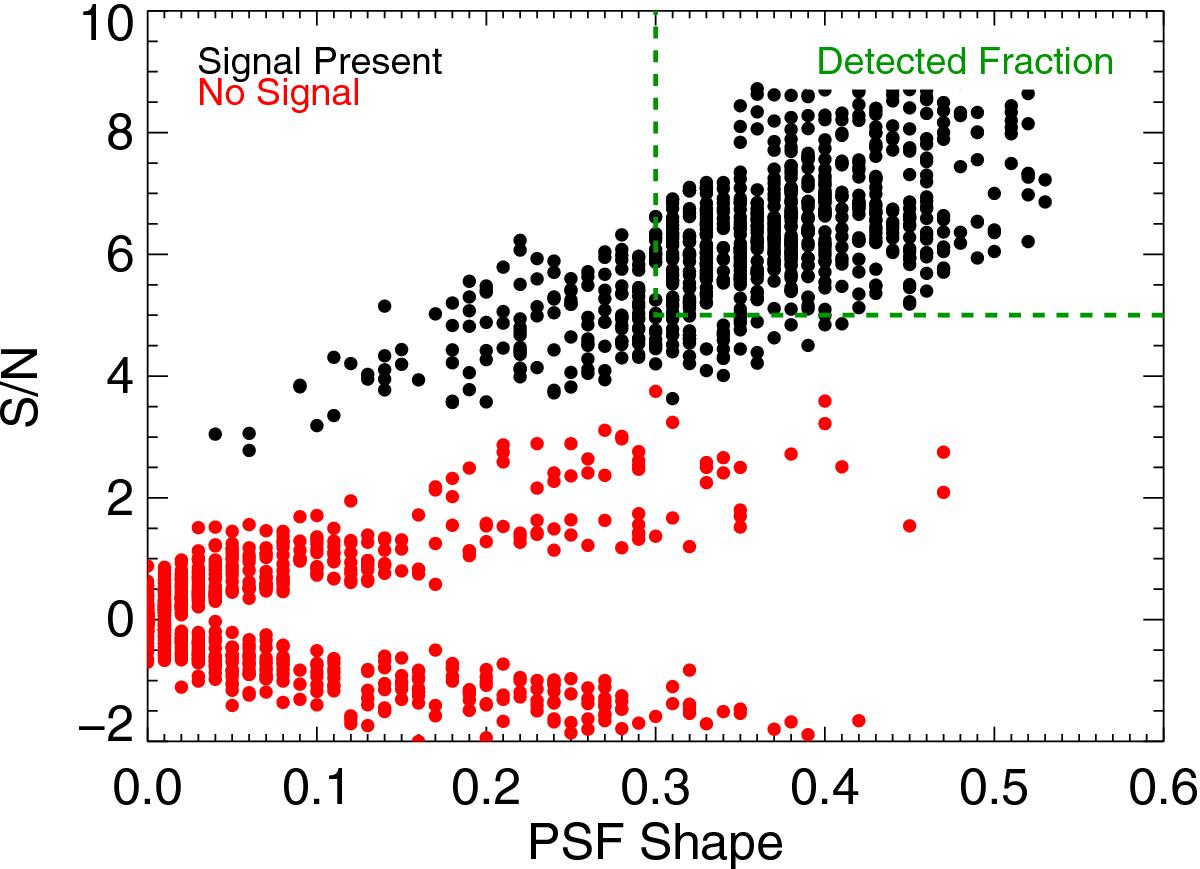
A demonstration that MLOCI does not increase false positive rates. The black dots show the measured signal to noise and PSF shape (same as fractional reduction in Sect. 4.1) of point sources injected at tests spots after 800 MLOCI reductions. The green dashed lines show the detection criteria defined in Sect. 4. The red dots show measurements for another 800 reductions where no signal was injected. No false positives were found; the red dots lie outside the green box and reasonably far from the detection limits. Moreover, the standard deviations of the black and red S/N distributions are 1.2 and 1, respectively.
Current usage metrics show cumulative count of Article Views (full-text article views including HTML views, PDF and ePub downloads, according to the available data) and Abstracts Views on Vision4Press platform.
Data correspond to usage on the plateform after 2015. The current usage metrics is available 48-96 hours after online publication and is updated daily on week days.
Initial download of the metrics may take a while.