Fig. 4
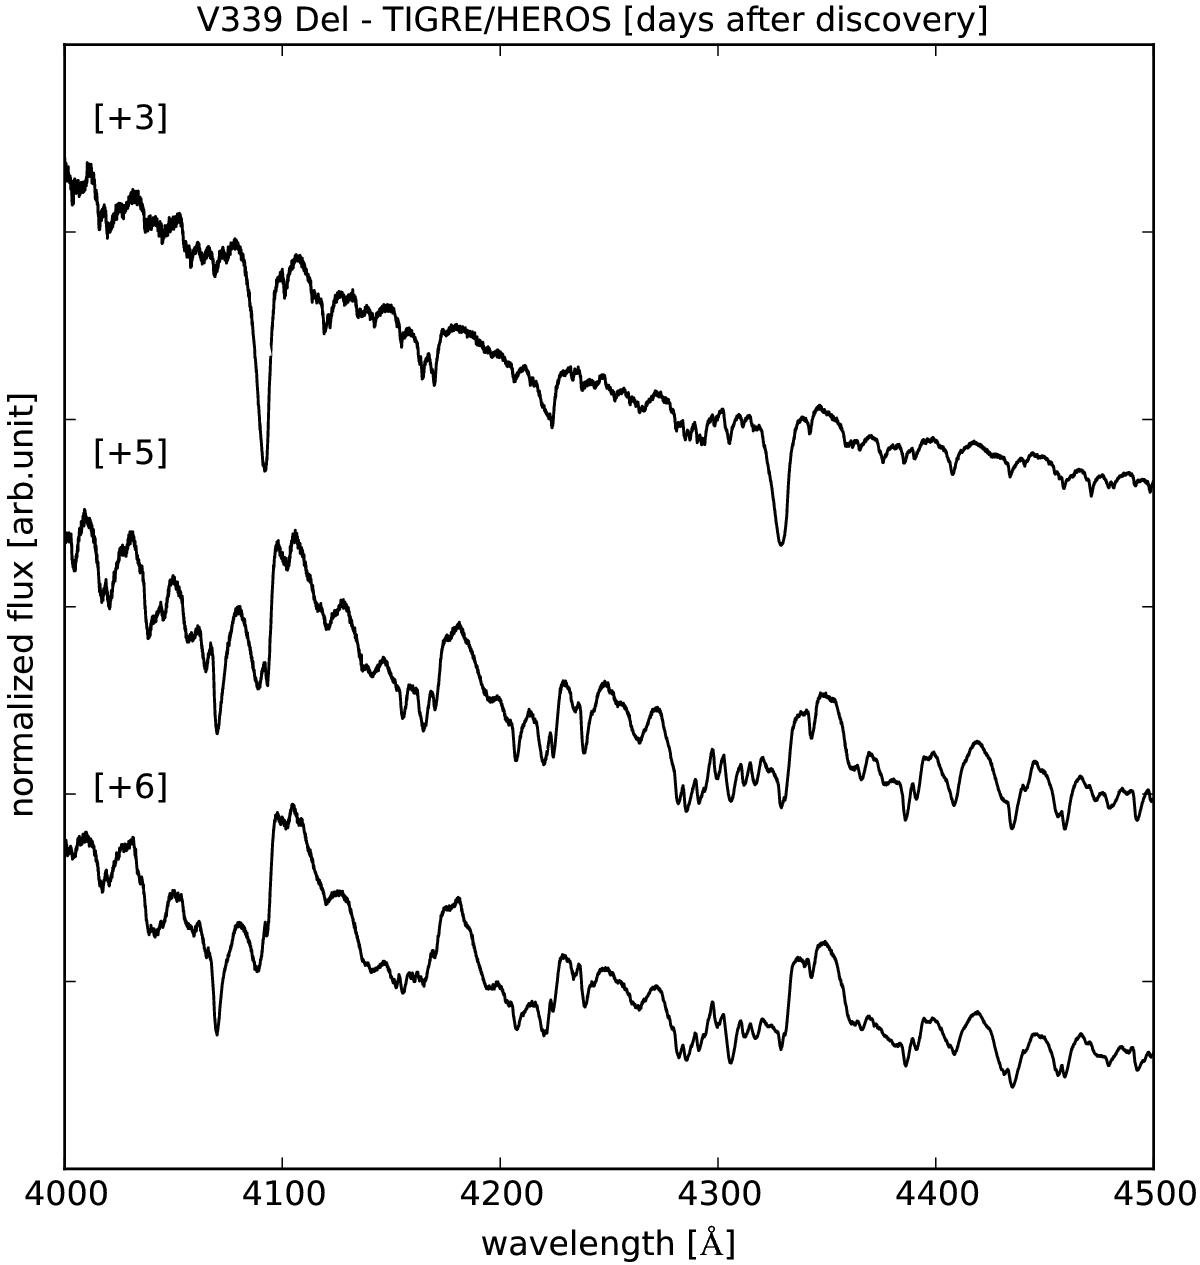
On day +3, the two most relevant lines seen here are Hγ and Hδ, both exhibiting P-Cyg-like profiles, while the other species, mainly Fe II, show only narrow absorption features. Later (days +5 and +6) the spectrum consists of a multitude of wide, overlapping emission line profiles.
Current usage metrics show cumulative count of Article Views (full-text article views including HTML views, PDF and ePub downloads, according to the available data) and Abstracts Views on Vision4Press platform.
Data correspond to usage on the plateform after 2015. The current usage metrics is available 48-96 hours after online publication and is updated daily on week days.
Initial download of the metrics may take a while.