Fig. 2a
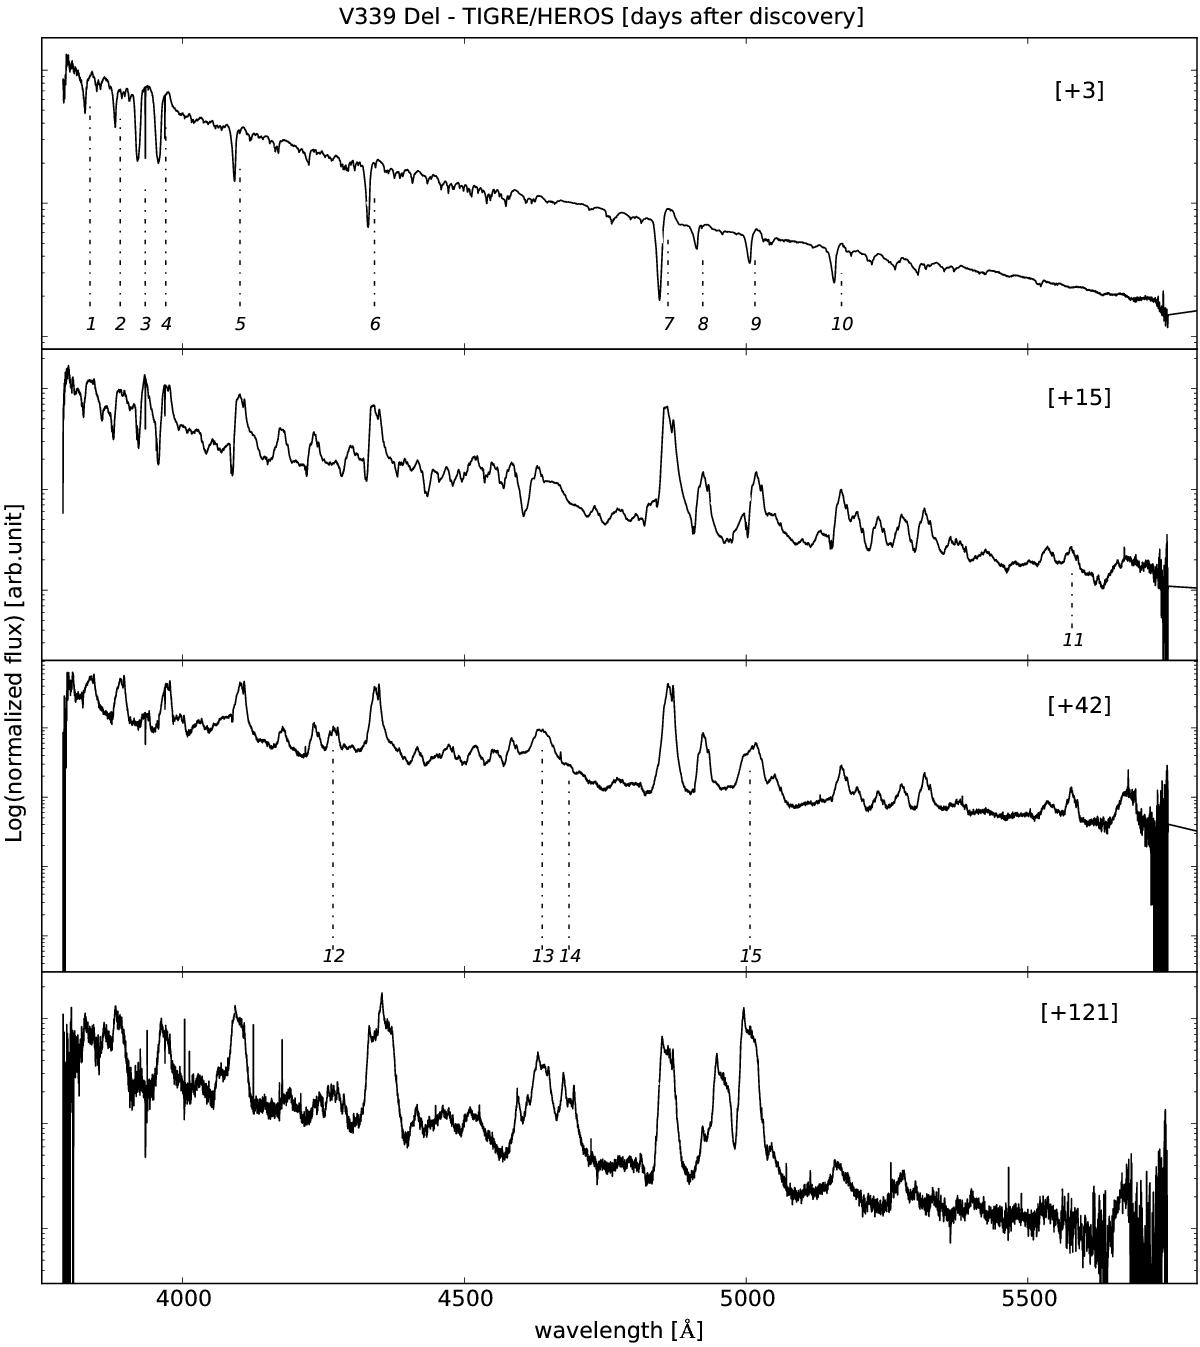
TIGRE/HEROS spectra from days +3 (optically thick phase), +15 (transition phase), +42 (early nebular phase), and +121 (late nebular phase) after discovery. Blue channel. The spectra are blaze-normalized and subsequently normalized to a polynomial instrumental response function. No absolute flux calibration has been applied. Flux is shown on a logarithmic scale to better display the several spectroscopic features. The most relevant lines are numbered in italics, and for their identifications see Table 2.
Current usage metrics show cumulative count of Article Views (full-text article views including HTML views, PDF and ePub downloads, according to the available data) and Abstracts Views on Vision4Press platform.
Data correspond to usage on the plateform after 2015. The current usage metrics is available 48-96 hours after online publication and is updated daily on week days.
Initial download of the metrics may take a while.