Fig. 1
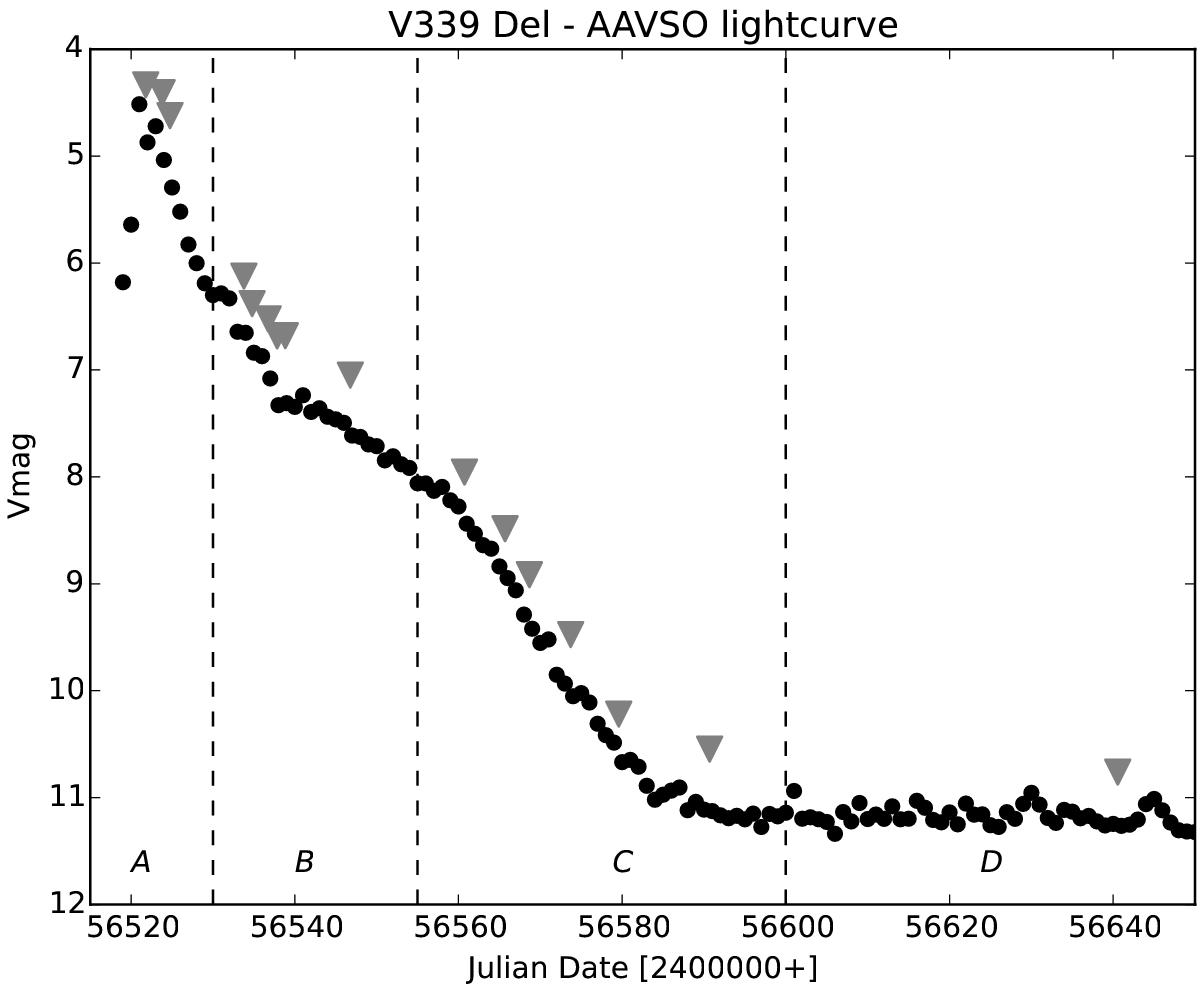
Lightcurve of V339 Del in the V band. The dots represent daily averages from the AAVSO data. The vertical lines separate the different phases discussed in Sect. 3: A. optically thick; B. transition; C. early nebular; D. late nebular. The triangles mark the TIGRE observations (Table 1).
Current usage metrics show cumulative count of Article Views (full-text article views including HTML views, PDF and ePub downloads, according to the available data) and Abstracts Views on Vision4Press platform.
Data correspond to usage on the plateform after 2015. The current usage metrics is available 48-96 hours after online publication and is updated daily on week days.
Initial download of the metrics may take a while.