Fig. 1
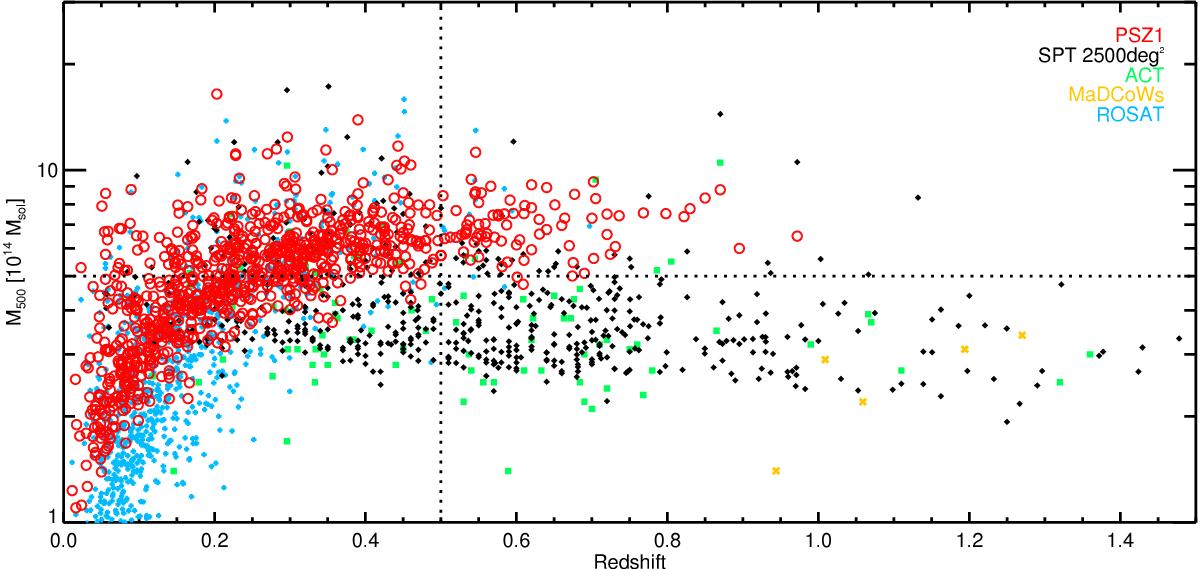
Distribution in the M–z plane of the Planck SZ cluster catalogue (open red circles; Planck Collaboration XXIX 2014) compared with those from SPT (black; Reichardt et al. 2013; Bleem et al. 2015) and ACT (green; Marriage et al. 2011; Hasselfield et al. 2013), MaDCoWS (yellow; Brodwin et al. 2015), and NORAS and REFLEX from the MCXC meta-catalogue (blue; Piffaretti et al. 2011 and references therein). Some clusters may appear several times as distinct points as a result of differences in the mass estimate between surveys. The black dotted lines show the Planck mass limit for the medium-deep survey zone at 20% completeness (as defined in Planck Collaboration XXIX 2014) for a redshift limit of z = 0.5.
Current usage metrics show cumulative count of Article Views (full-text article views including HTML views, PDF and ePub downloads, according to the available data) and Abstracts Views on Vision4Press platform.
Data correspond to usage on the plateform after 2015. The current usage metrics is available 48-96 hours after online publication and is updated daily on week days.
Initial download of the metrics may take a while.