Fig. 6
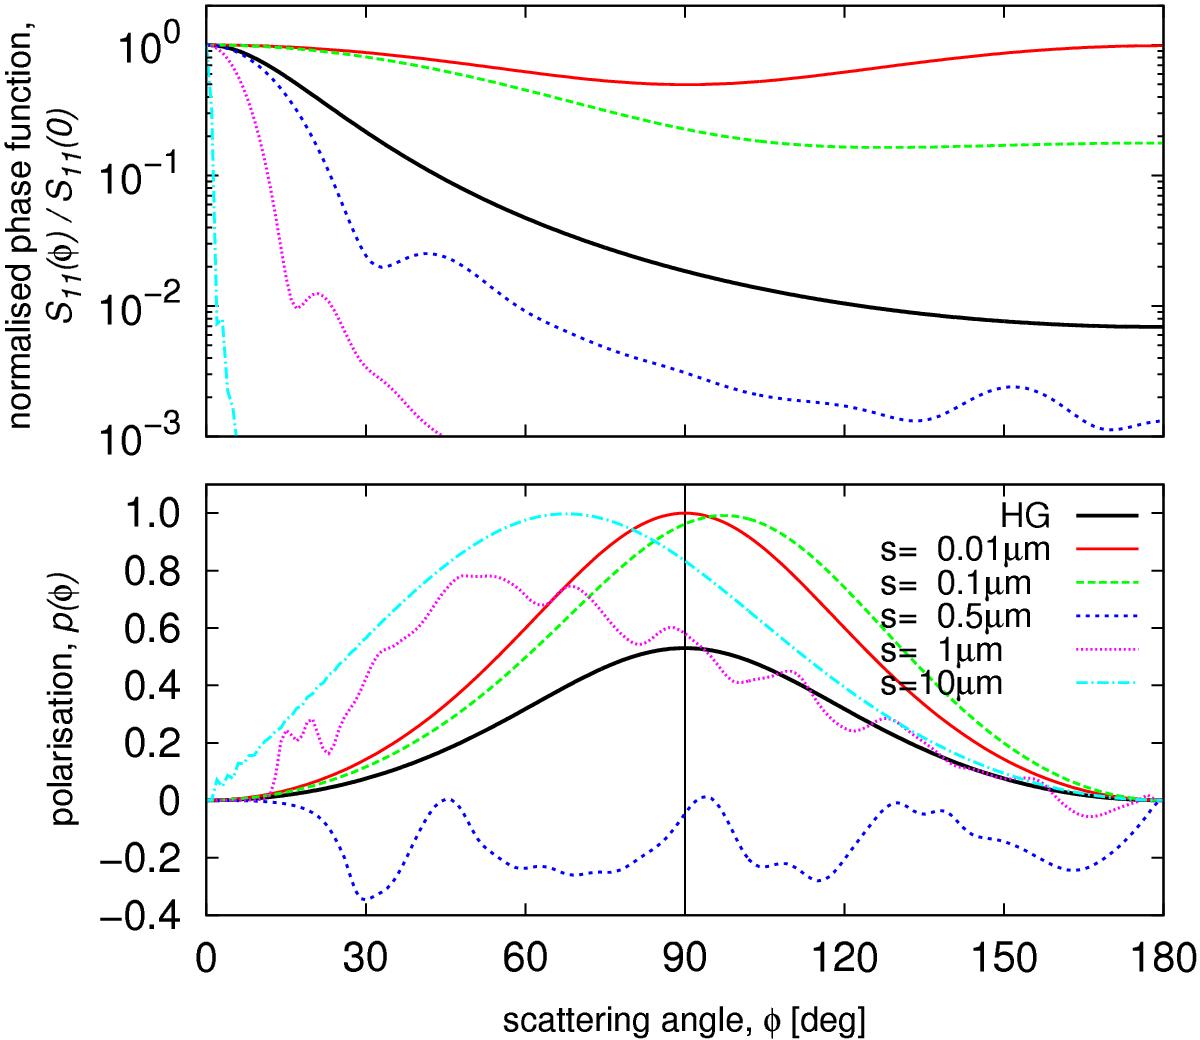
Normalised scattering phase function (top) and polarisation (bottom) vs. scattering angle in V band. Solid black lines have been inferred by Graham et al. (2007) via a Henyey-Greenstein model. The coloured lines are for Mie spheres with radii s, made of material M1.
Current usage metrics show cumulative count of Article Views (full-text article views including HTML views, PDF and ePub downloads, according to the available data) and Abstracts Views on Vision4Press platform.
Data correspond to usage on the plateform after 2015. The current usage metrics is available 48-96 hours after online publication and is updated daily on week days.
Initial download of the metrics may take a while.