Fig. 5
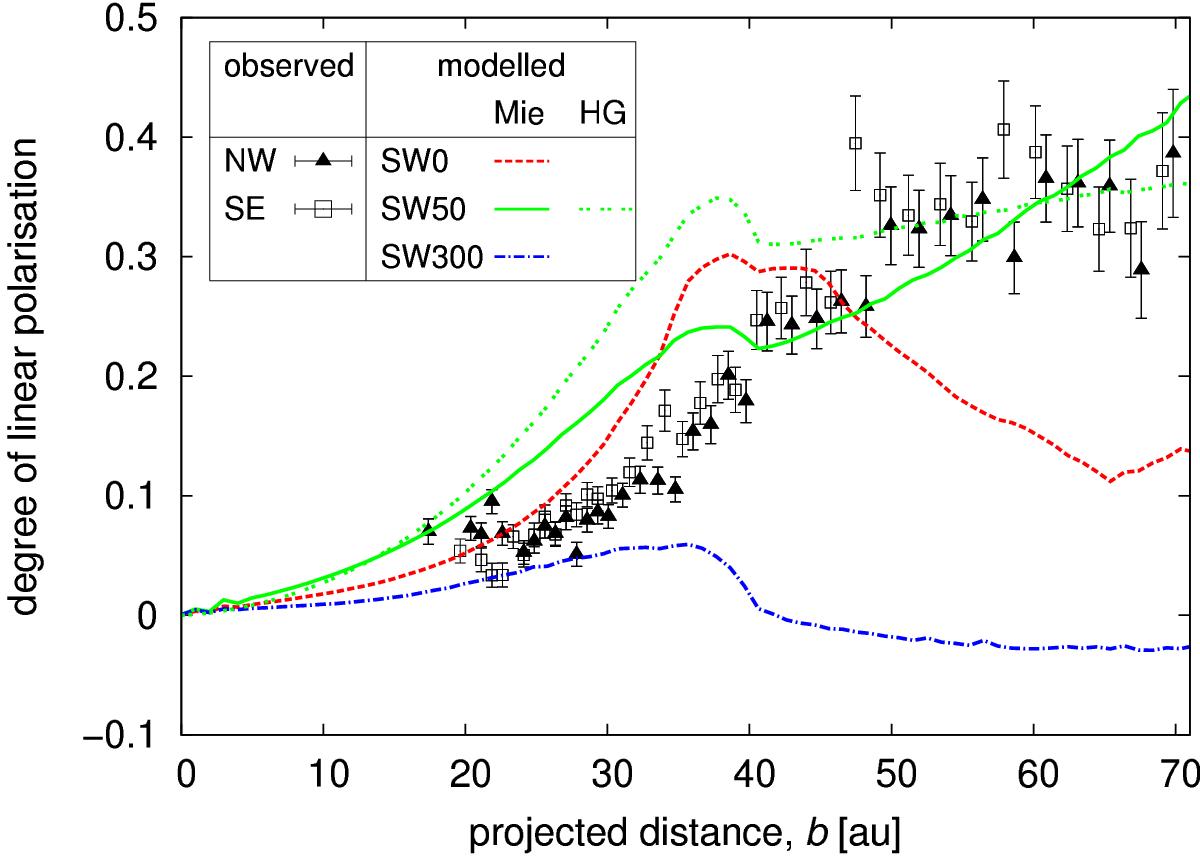
Degree of polarisation as a function of projected distance. Squares and triangles are measurements for the SE and NW ansae, respectively (Graham et al. 2007). The double-dotted green line was obtained with the Henyey-Greenstein model of Graham et al. (2007), whereas the other lines are results from Mie theory.
Current usage metrics show cumulative count of Article Views (full-text article views including HTML views, PDF and ePub downloads, according to the available data) and Abstracts Views on Vision4Press platform.
Data correspond to usage on the plateform after 2015. The current usage metrics is available 48-96 hours after online publication and is updated daily on week days.
Initial download of the metrics may take a while.