Fig. 4
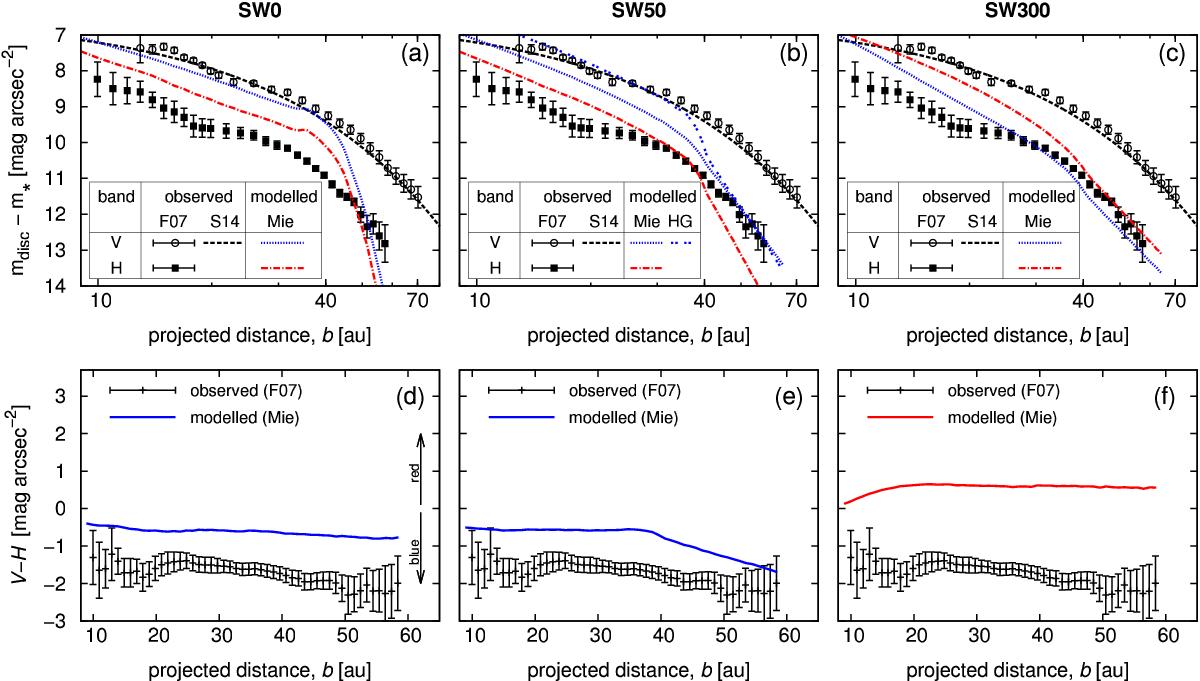
Scattered light profiles of the AU Mic disc. a)−c): blue and red lines show synthetic midplane surface brightness profiles in V and H band relative to the stellar brightness for the disc models SW0, SW50, and SW300 (Sect. 4.1). Curves labelled with Mie in the legend were calculated with scattering phase functions obtained by means of Mie theory. The blue double-dotted line in panel b) depicts the V-band profile generated with the best-fit Henyey-Greenstein (HG) phase function model of Graham et al. (2007). Dots represent measurements with 1σ errors from Fitzgerald et al. (2007), abbreviated as F07, averaged over the SE and NW wings (circles for V band, squares for H band). The black dashed line shows the averaged V-band fit to both wings obtained by Schneider et al. (2014), abbreviated as S14. d)−f): observed and modelled colour profiles, V − H, obtained with the F07 data and the Mie profiles shown in panels a)−c).
Current usage metrics show cumulative count of Article Views (full-text article views including HTML views, PDF and ePub downloads, according to the available data) and Abstracts Views on Vision4Press platform.
Data correspond to usage on the plateform after 2015. The current usage metrics is available 48-96 hours after online publication and is updated daily on week days.
Initial download of the metrics may take a while.