Fig. 2
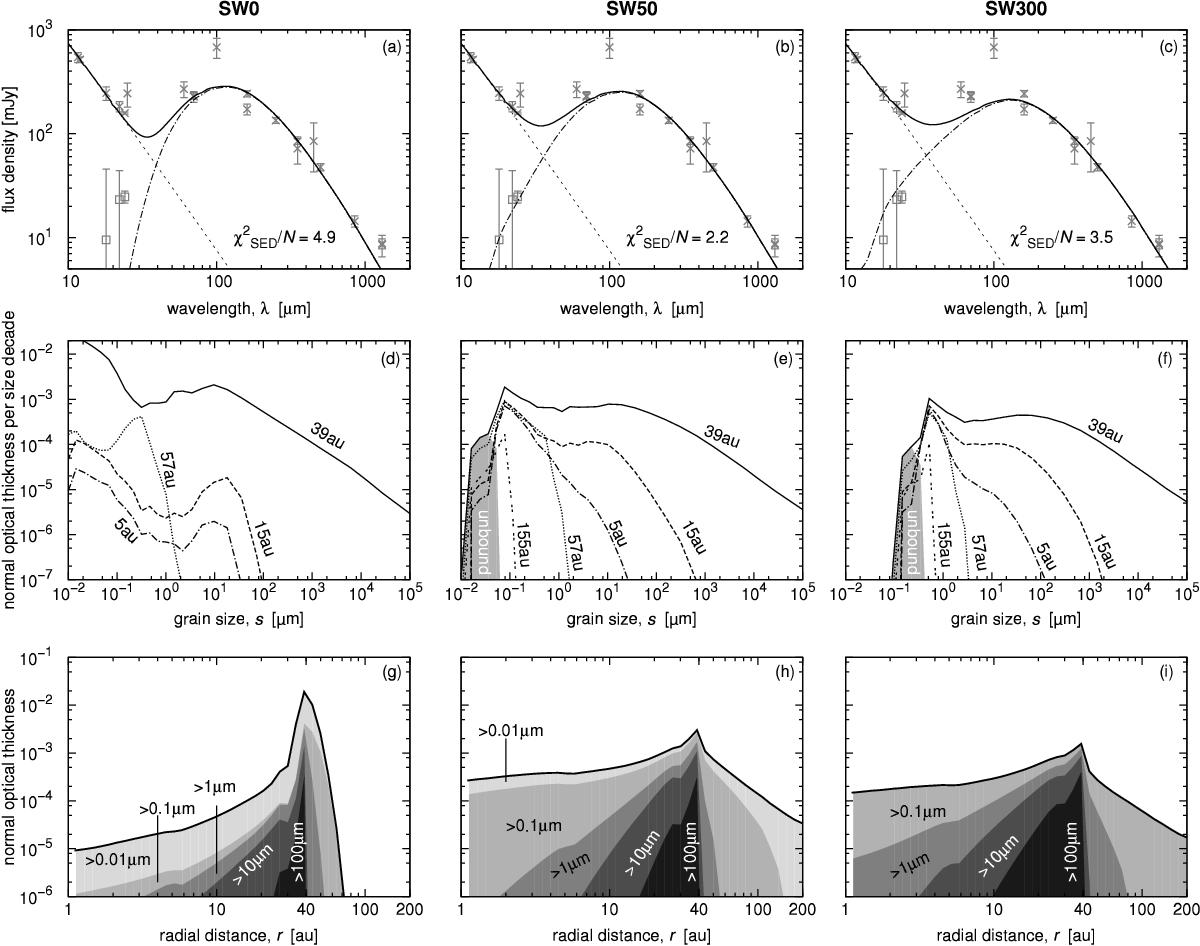
Disc models of narrow planetesimal belts centred at 40 au with different assumptions
for the stellar wind (SW) strength (from left to right
Ṁ⋆ = 0,50,300
Ṁ⊙). a)−c): SEDs. Crosses show
photometric data and squares star-subtracted photometric data. The dashed lines depict
the stellar photosphere, the dash-dotted lines the disc emission, and the solid lines
the star+disc emission. The ![]() were obtained using the
N = 20
photometric points in the plotted range. d)−f): normal optical
thickness as a function of grain size at different distances from the star. The solid
curves (r =
39 au) show the particle distribution within the parent belt.
Shaded regions depict the contribution of grains on unbound orbits at r = 39 au.
g)−i): normal optical thickness as a function of
distance from the star. Shaded regions indicate the contributions from different size
ranges.
were obtained using the
N = 20
photometric points in the plotted range. d)−f): normal optical
thickness as a function of grain size at different distances from the star. The solid
curves (r =
39 au) show the particle distribution within the parent belt.
Shaded regions depict the contribution of grains on unbound orbits at r = 39 au.
g)−i): normal optical thickness as a function of
distance from the star. Shaded regions indicate the contributions from different size
ranges.
Current usage metrics show cumulative count of Article Views (full-text article views including HTML views, PDF and ePub downloads, according to the available data) and Abstracts Views on Vision4Press platform.
Data correspond to usage on the plateform after 2015. The current usage metrics is available 48-96 hours after online publication and is updated daily on week days.
Initial download of the metrics may take a while.