Fig. 10
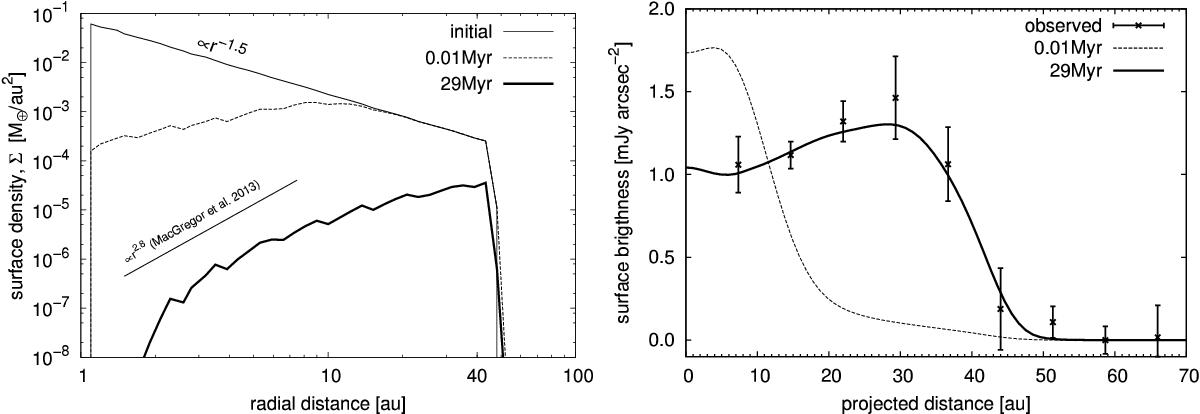
Left: time evolution of the surface density in an extended planetesimal disc (ΔrPB ≈ 45 au). The wavy structures of the Σ-curves are numerical artefacts. For the sake of comparison, the straight line shows the Σ-slope derived by MacGregor et al. (2013). Right: time evolution of the 1.3 mm profile along with the ALMA data. The 0.01 Myr surface brightness profile was scaled by a factor of 0.05 for better visibility.
Current usage metrics show cumulative count of Article Views (full-text article views including HTML views, PDF and ePub downloads, according to the available data) and Abstracts Views on Vision4Press platform.
Data correspond to usage on the plateform after 2015. The current usage metrics is available 48-96 hours after online publication and is updated daily on week days.
Initial download of the metrics may take a while.