Fig. 8
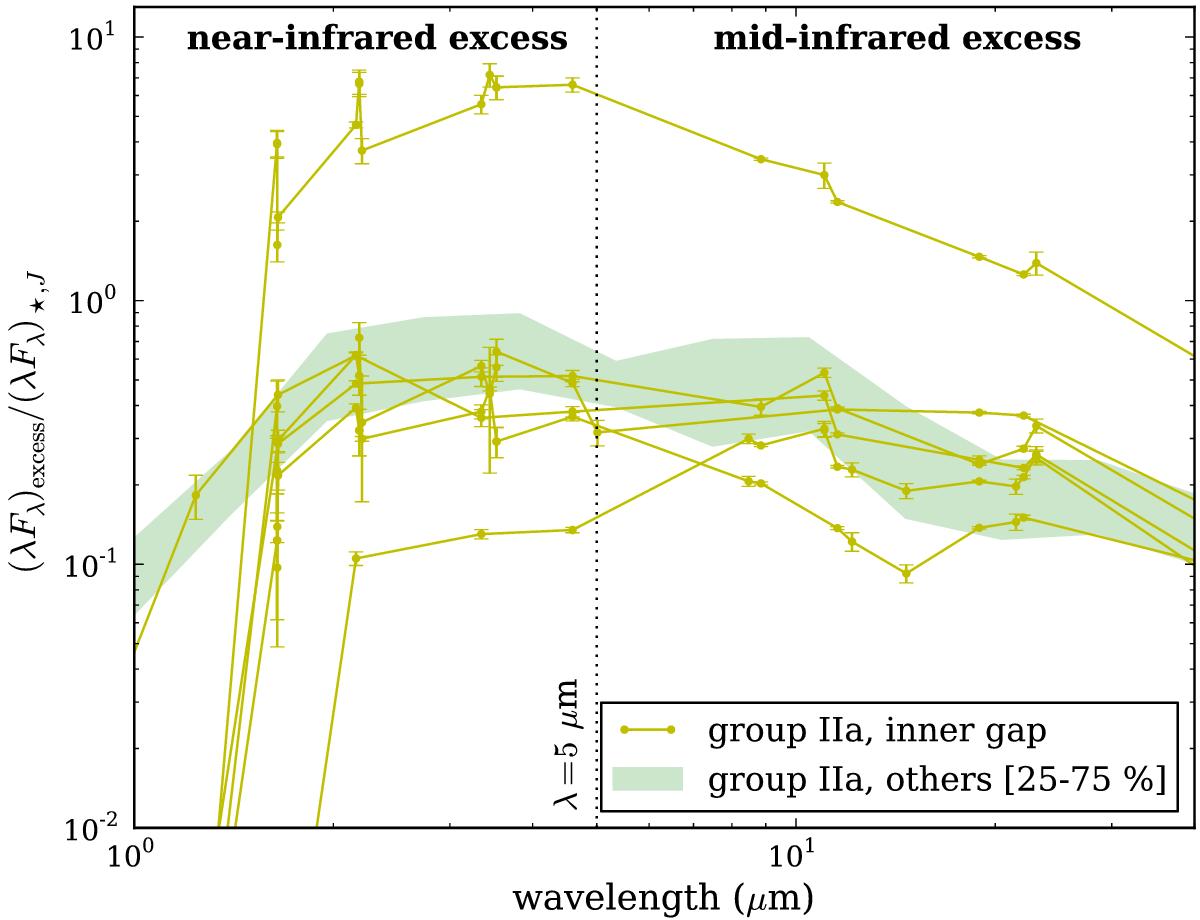
Near- and mid-infrared excess SED of the group IIa stars in the sample. The SEDs are normalized to the stellar flux in the J band (λ = 1.24 μm). The full yellow lines indicate sources with observed or suspected gaps. The shaded green zone show the 25% to 75% percentile of the other objects. Sources with gaps generally have slightly lower near-infrared excesses than gapless sources.
Current usage metrics show cumulative count of Article Views (full-text article views including HTML views, PDF and ePub downloads, according to the available data) and Abstracts Views on Vision4Press platform.
Data correspond to usage on the plateform after 2015. The current usage metrics is available 48-96 hours after online publication and is updated daily on week days.
Initial download of the metrics may take a while.