Fig. 6
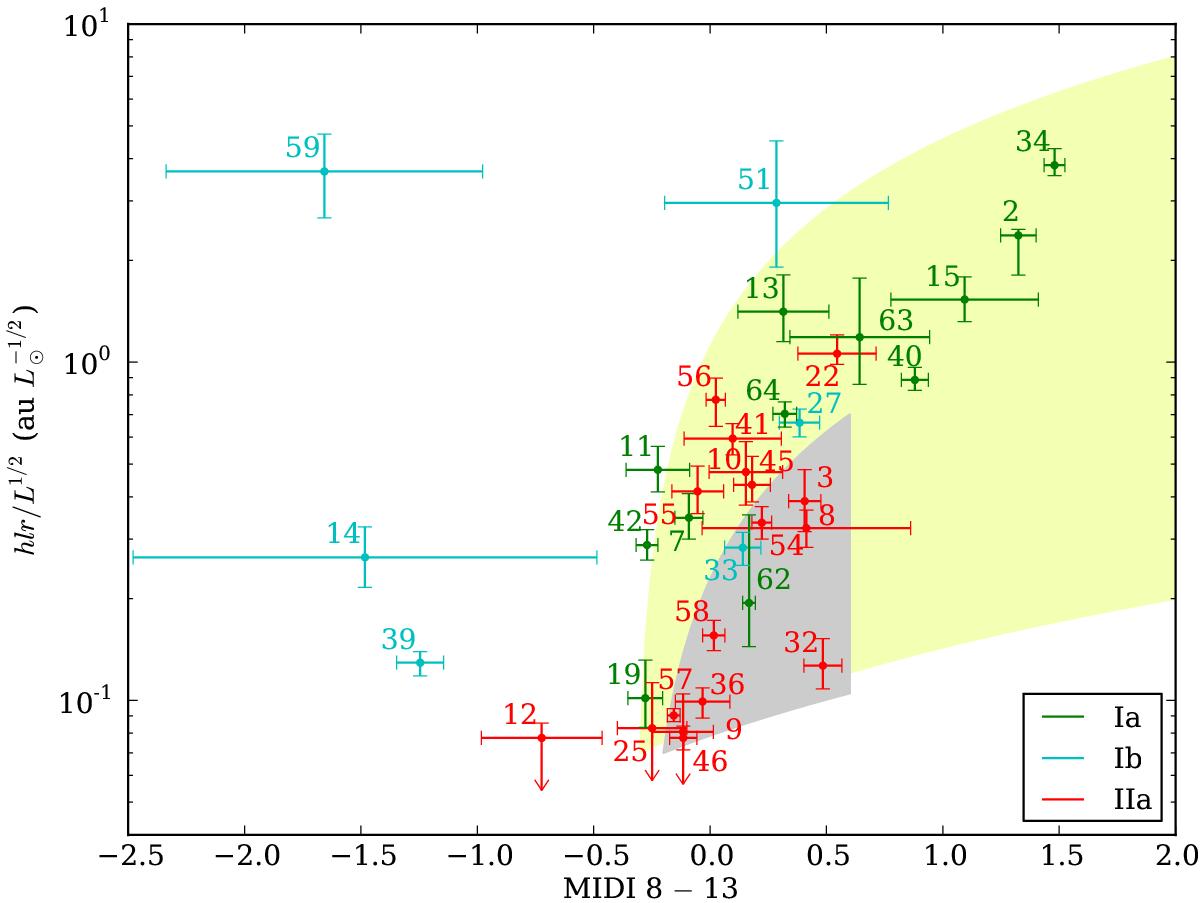
Merged size-color diagram, combining observations (Fig. 4) with the model population (Fig. 5). In gray, we indicate the range of models without a gap. In yellow, we show the approximate range of models with a gap between the inner halo and the disk component. We note that both regions indeed overlap. Group Ib sources with colors deferring from the model population are V1247 Ori (#14), HD 135344 B (#39), Elias 2–30 (#51), and HD 169142 (#59).
Current usage metrics show cumulative count of Article Views (full-text article views including HTML views, PDF and ePub downloads, according to the available data) and Abstracts Views on Vision4Press platform.
Data correspond to usage on the plateform after 2015. The current usage metrics is available 48-96 hours after online publication and is updated daily on week days.
Initial download of the metrics may take a while.