Fig. 5
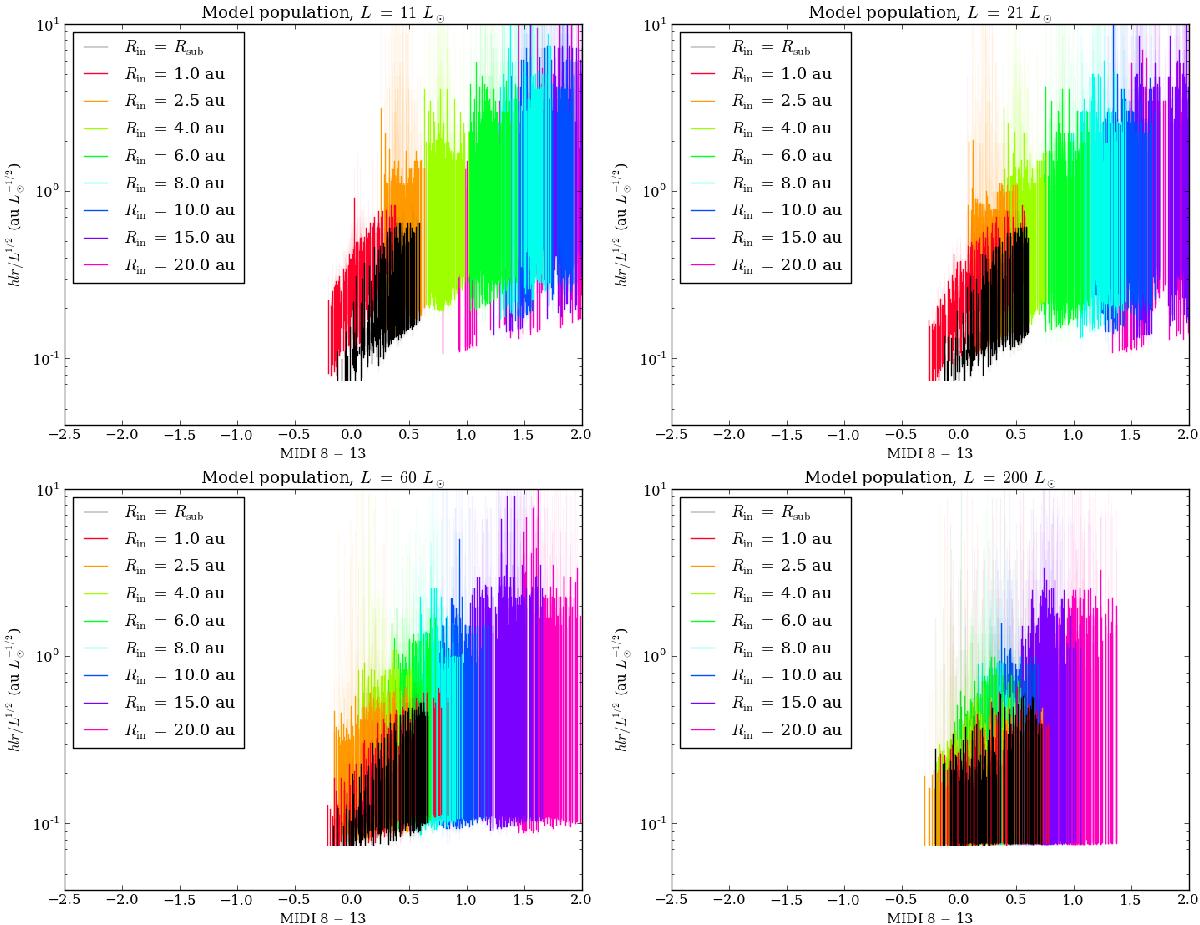
Size-color diagram for the population of radiative-transfer models for the four different luminosity cases (11 L⊙, 21 L⊙, 60 L⊙, and 200 L⊙). The vertical lines indicate the range of sizes that can be obtained for the individual models. The 5% smallest and 5% largest mid-infrared sizes are shown in transparent colors, giving an idea of the typical (90%) range of model sizes. In black, the models without a gap are shown. The other colors show models with a gap between the halo and the disk components (for an increasing disk inner radius Rin).
Current usage metrics show cumulative count of Article Views (full-text article views including HTML views, PDF and ePub downloads, according to the available data) and Abstracts Views on Vision4Press platform.
Data correspond to usage on the plateform after 2015. The current usage metrics is available 48-96 hours after online publication and is updated daily on week days.
Initial download of the metrics may take a while.