Free Access
Fig. 3
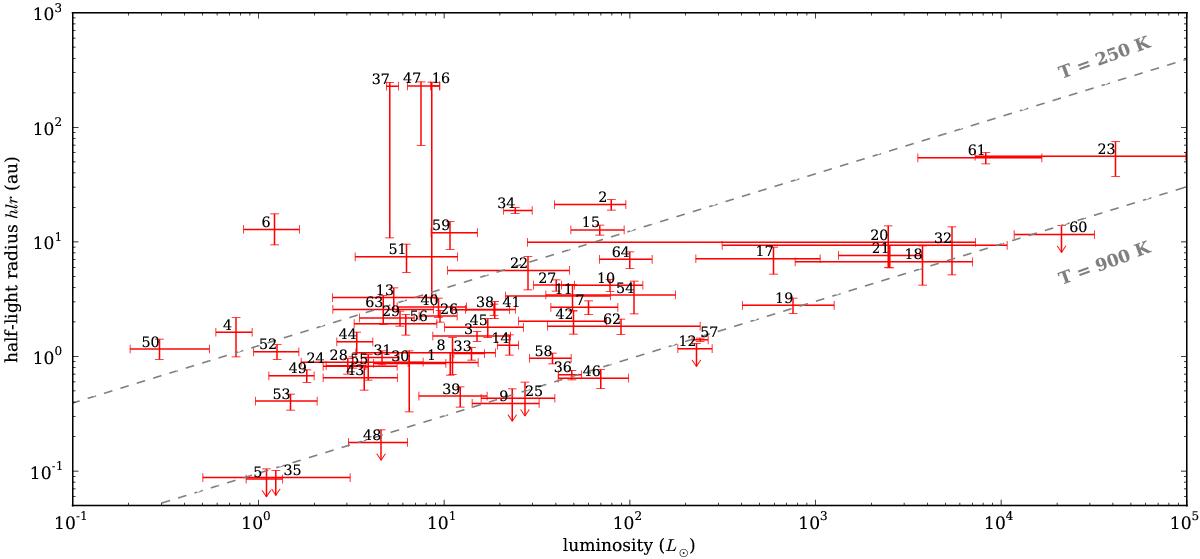
MIDI size-luminosity diagram for protoplanetary disks: plot of the half-light radii of the disks at 10.7 μm vs. the stellar luminosity of the sample targets. The gray dashed lines indicate the expected distance at which gray, optically thin dust at the indicated temperature would be located (cf. Monnier et al. 2009).
Current usage metrics show cumulative count of Article Views (full-text article views including HTML views, PDF and ePub downloads, according to the available data) and Abstracts Views on Vision4Press platform.
Data correspond to usage on the plateform after 2015. The current usage metrics is available 48-96 hours after online publication and is updated daily on week days.
Initial download of the metrics may take a while.