Fig. 6
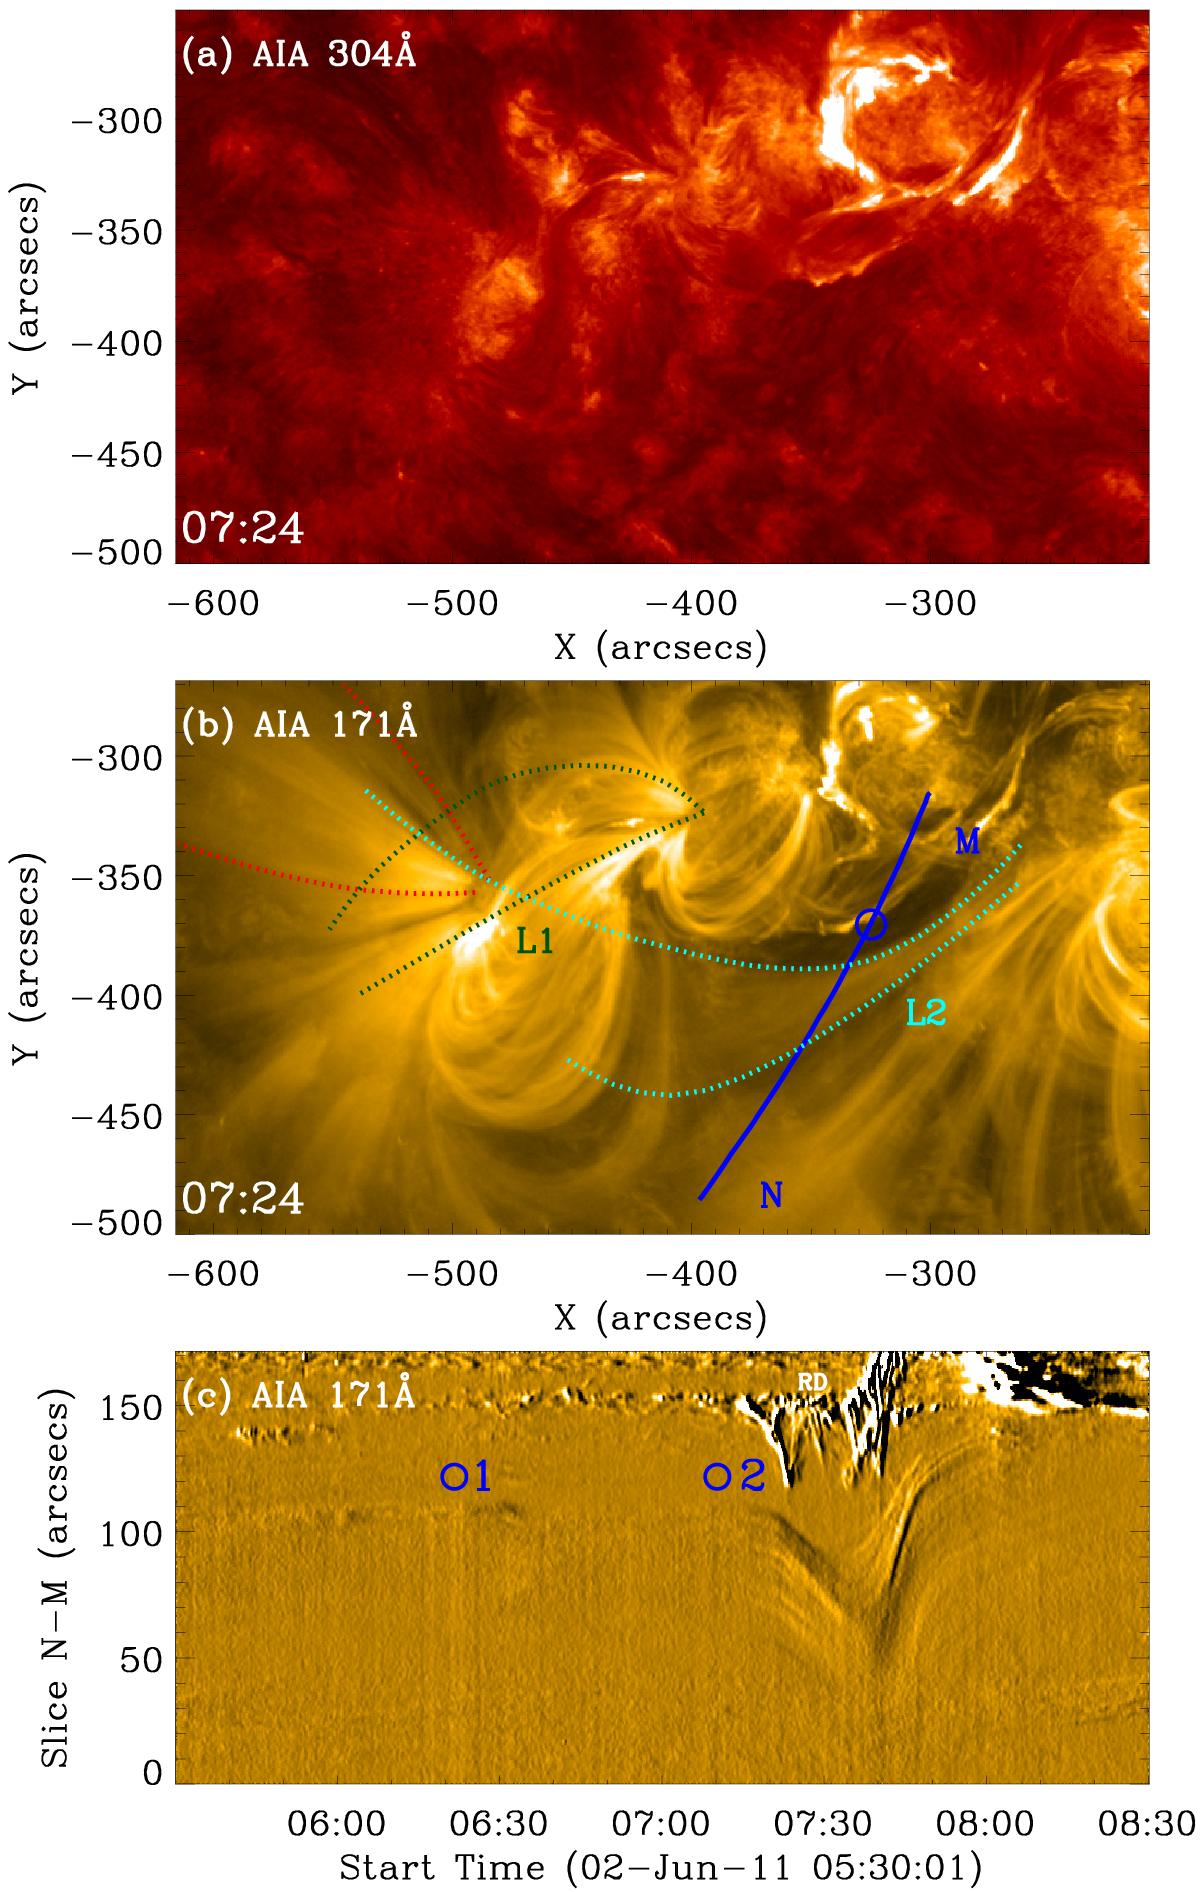
Panels a) and b) are 304Å and 171Å images taken by SDO/AIA at 07:24 UT on 2011 June 2. In panel b), the red dotted lines indicate the propagation range of the fast mode waves along the funnel. L1 and L2, denoted by the green and light blue dotted lines, respectively, are the loop systems overlapping before or after the funnel in the image. Panel c) is a time-distance map showing the intensity change along slice MN shown in blue in panel b). The blue circles in both panels b) and c) are located at the same spatial position of slice MN. Digits 1 and 2 mark the start times of the C1.4 and C3.7 flares in ARs 11226 and 11227, respectively. The temporal evolution of the 304Å and 171Å emission is illustrated by a running difference movie available online. The field-of-view of the movie is the same as that in panels a) and b). The time delay in the 304Å and 171Å difference movie are 1 min and 12 s (based on their available maximum temporal resolution), respectively.
Current usage metrics show cumulative count of Article Views (full-text article views including HTML views, PDF and ePub downloads, according to the available data) and Abstracts Views on Vision4Press platform.
Data correspond to usage on the plateform after 2015. The current usage metrics is available 48-96 hours after online publication and is updated daily on week days.
Initial download of the metrics may take a while.