Fig. 3
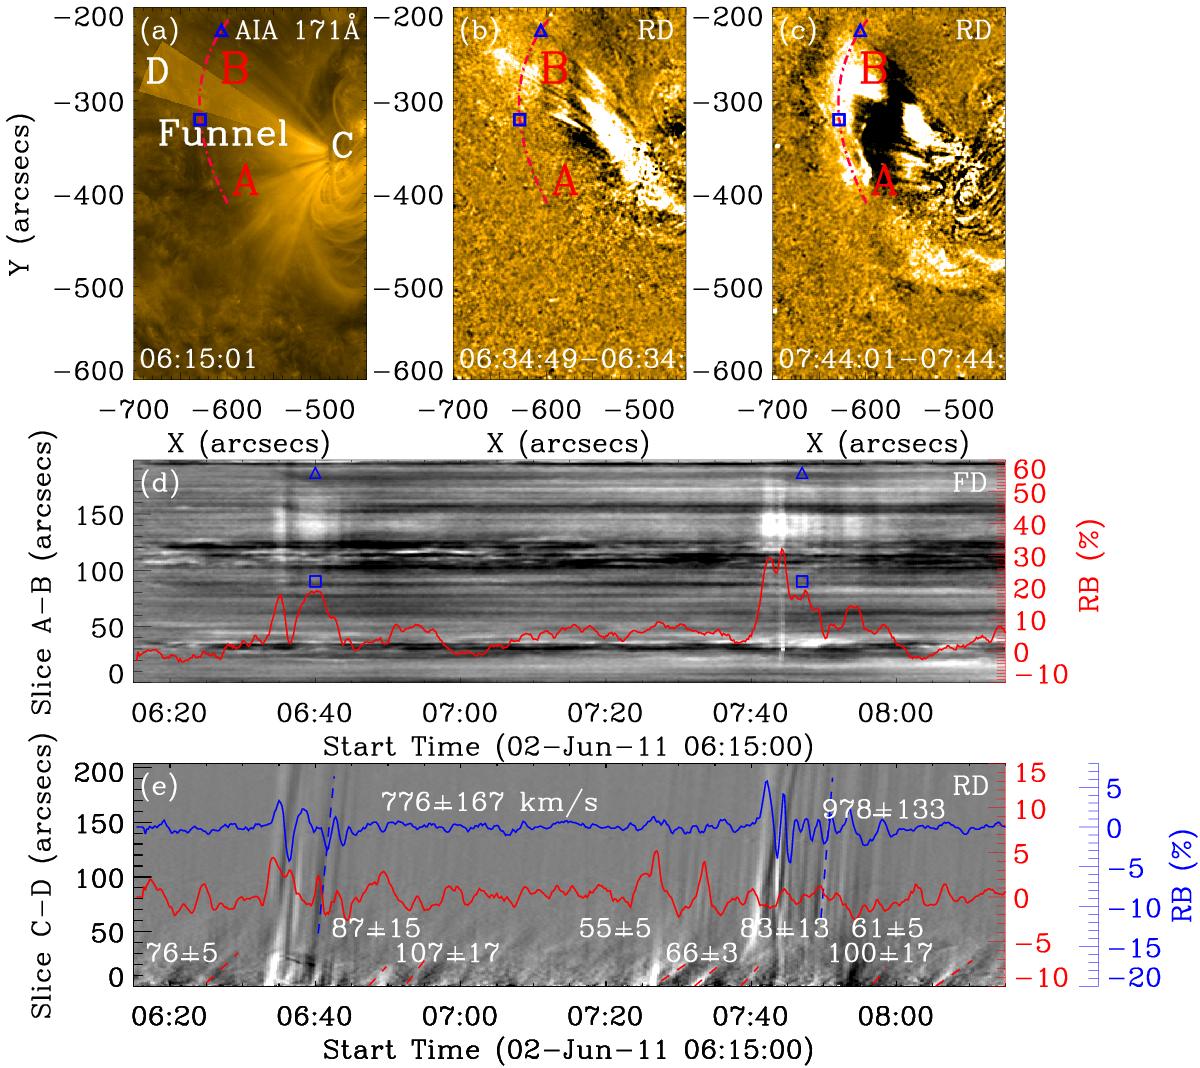
Panels a)–c) are SDO/AIA EUV 171 Å original and two running difference images. Panel d) is a time-distance image showing the brightness changes along the red dot-dashed curve AB marked in panels a)–c). The section of AB located between the small blue block and triangle denotes the propagating range of the fast waves. The red curve shows the time variation of EUV brightness difference at the distance of 100 Mm from point A. Panel e) is the time-distance map along the fan-like region “CD” positioned along the funnel loop system in panel a) and Fig. 1b. The red and blue curves show the time variations of EUV brightness difference at the distances of 1 Mm and 75 Mm from point C, respectively. The short red and blue dashed lines denote the diagonal structures corresponding to the slow and fast mode waves, respectively. In panel e) the signals are shown in relative brightness (RB).
Current usage metrics show cumulative count of Article Views (full-text article views including HTML views, PDF and ePub downloads, according to the available data) and Abstracts Views on Vision4Press platform.
Data correspond to usage on the plateform after 2015. The current usage metrics is available 48-96 hours after online publication and is updated daily on week days.
Initial download of the metrics may take a while.