Fig. 2
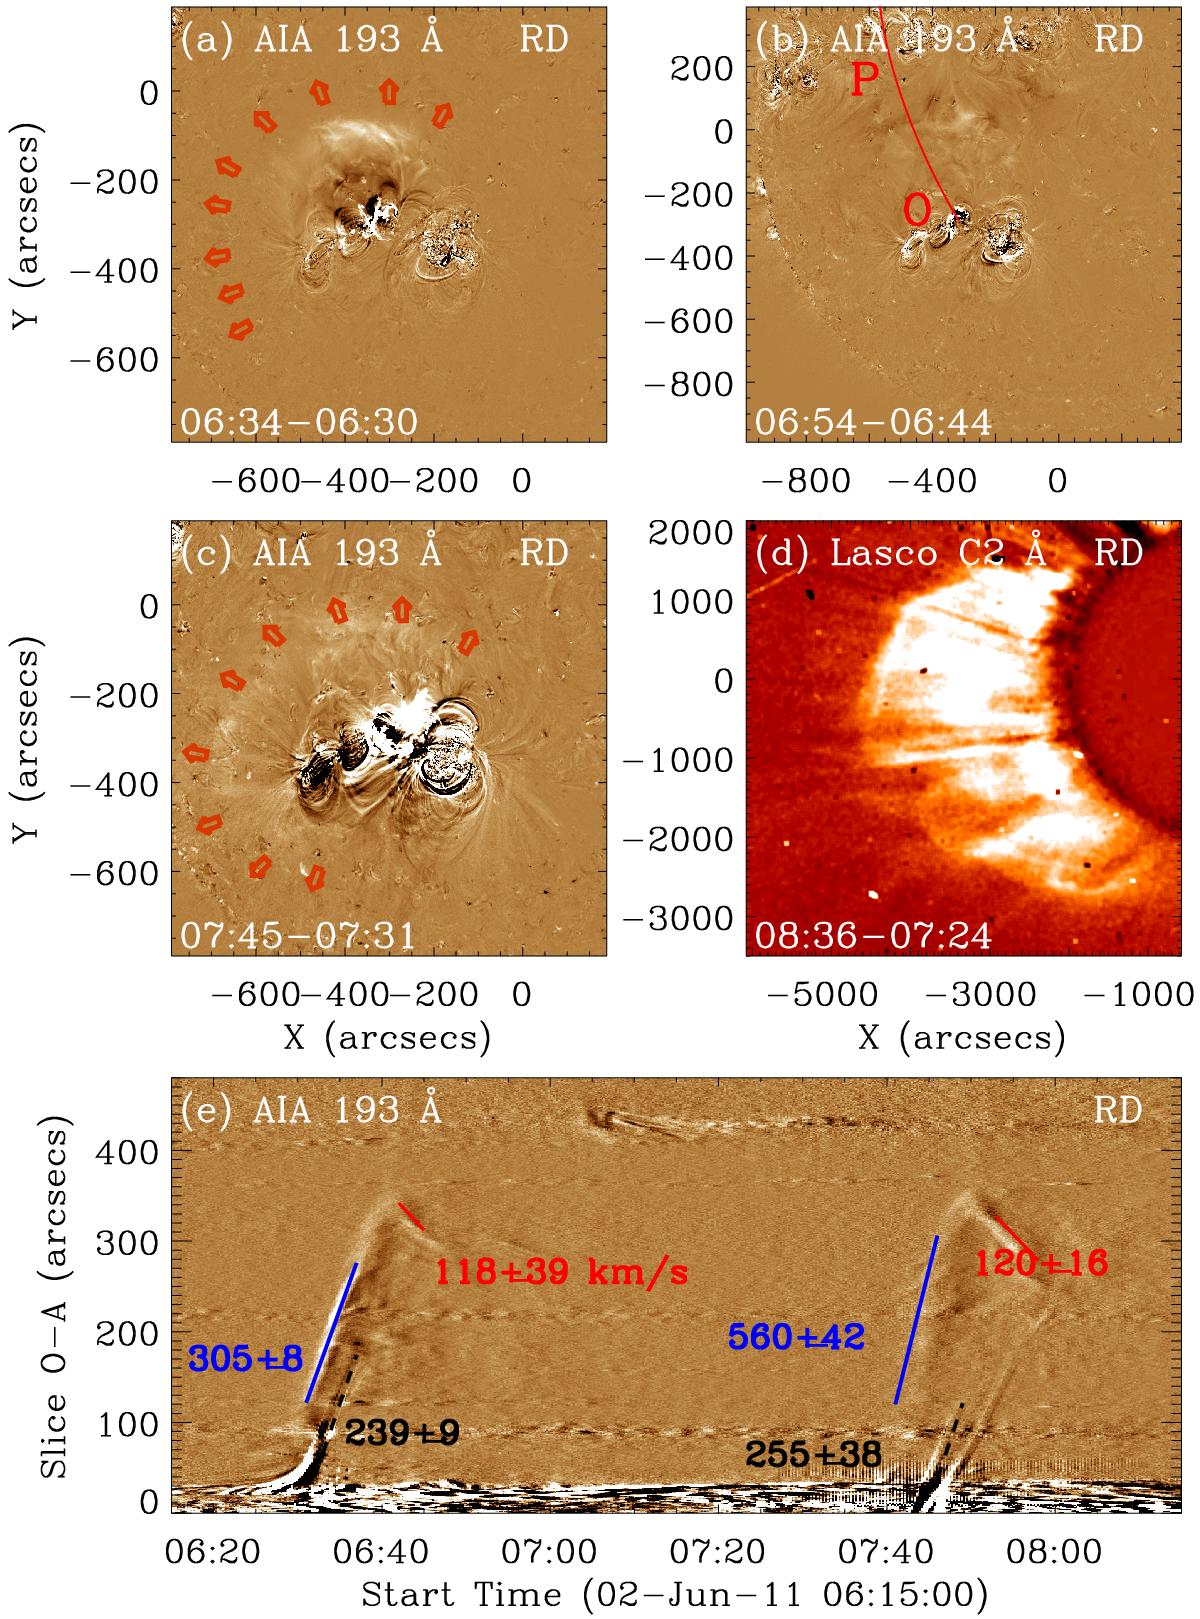
Panels a)–c) are running difference images based on the observations in EUV 193 Å by SDO/AIA. The arrows in panels a) and c) mark the wavefront of the EUV waves. The red line OP is the slit for making the time-distance images of panel e). Panel d) is a running difference image made with LASCO C2. The slopes of dashed lines, green lines, and red lines give the propagating speeds of the expanding erupted filament, EUV waves, and reflected EUV waves during the toroidal filament eruptions.
Current usage metrics show cumulative count of Article Views (full-text article views including HTML views, PDF and ePub downloads, according to the available data) and Abstracts Views on Vision4Press platform.
Data correspond to usage on the plateform after 2015. The current usage metrics is available 48-96 hours after online publication and is updated daily on week days.
Initial download of the metrics may take a while.