Fig. 1
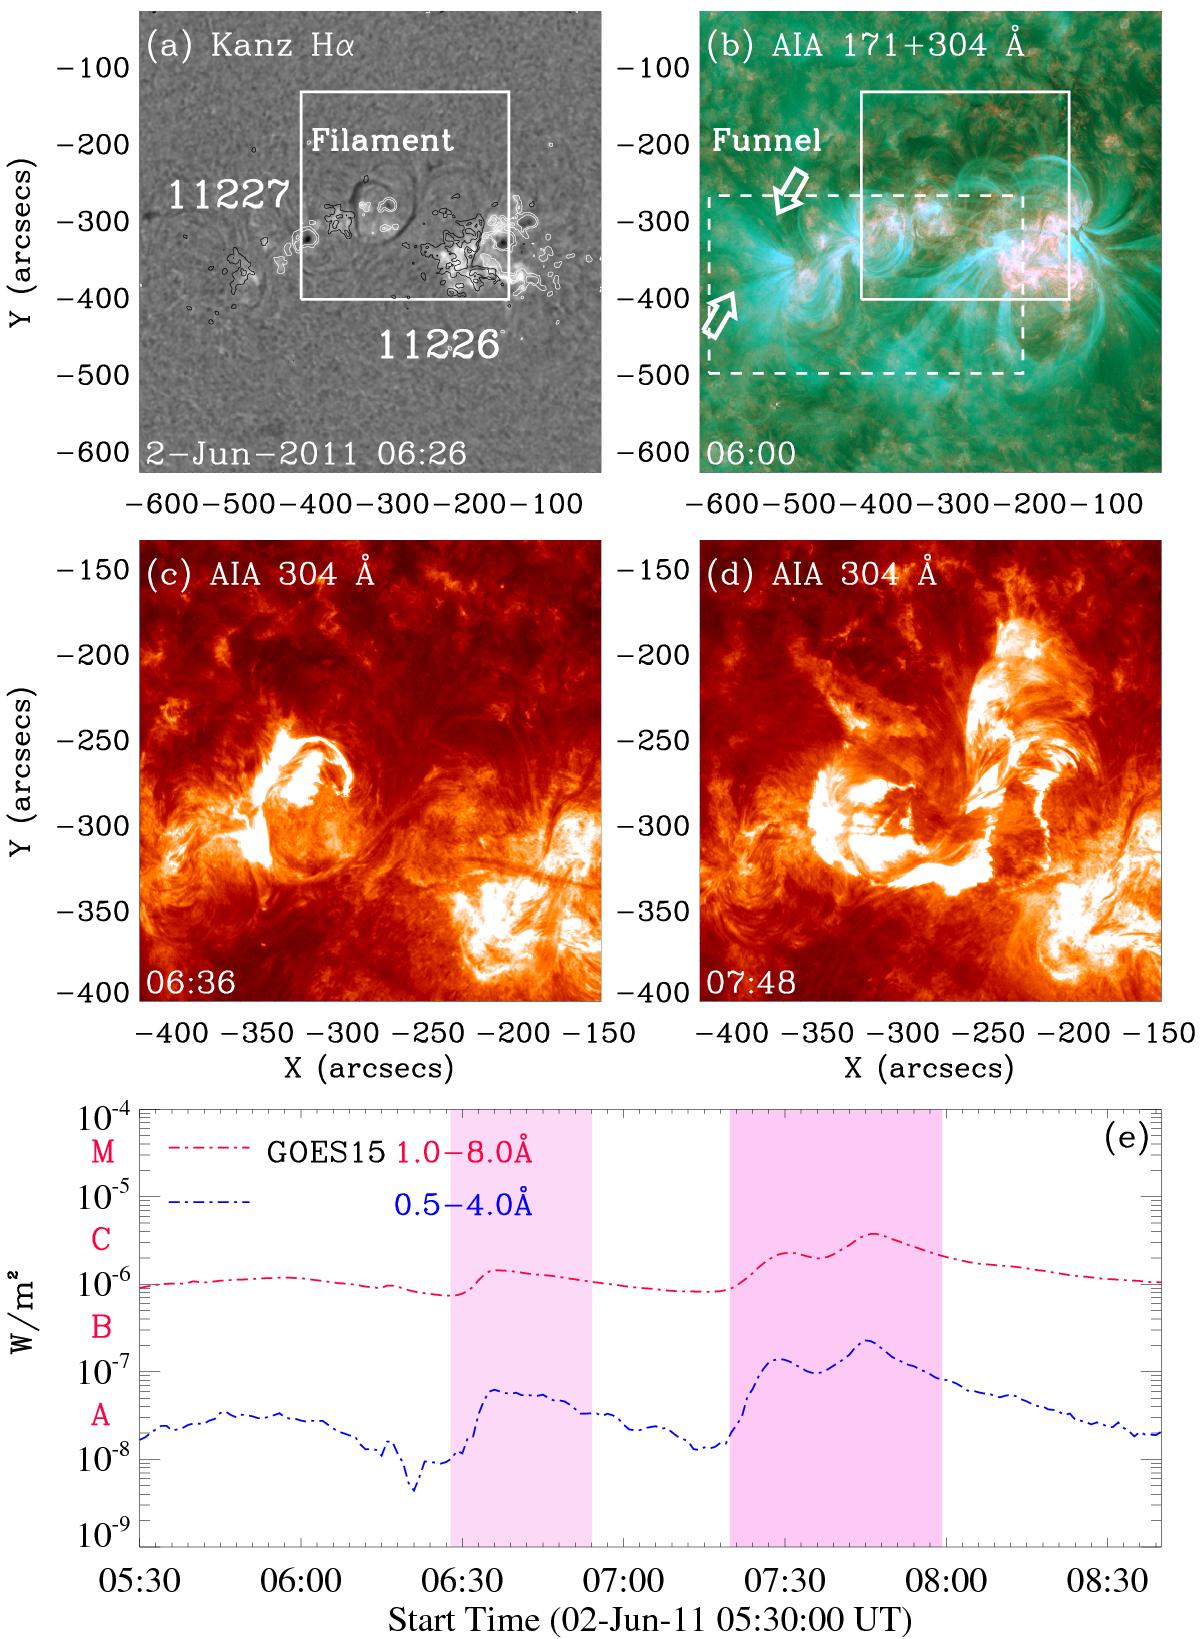
Panel a): Hα image made at 06:26 UT on 2011 June 2 by Kanzelhöhe Solar Observatory. A toroidal filament marked by “F” located at the joint of the ARs 11226 and 11227 (1″ ≈ 725 km) The contours are the line-of-sight magnetic flux density of + 300, +100 G (white) and −300, −100 G (black) measured with SDO/HMI; panel b): image made with the use of two SDO/AIA EUV wavebands, 171 Å and 304 Å, respectively. Slow and fast waves of EUV intensity are detected along the funnel loop system indicated by the arrow in panel b). The solid box in panels a) and b) shows the region zoomed in panels c) and d). The dashed box denotes the region shown in Fig. 6a. Panels c) and d) are SDO/AIA EUV 304 Å images, showing the double eruption processes of the toroidal filament. Panel e): solar X-ray flux recorded by GOES 15 in 1.0–8.0 Å (red) and 0.5−4.0 Å (blue). Two pink regions mark the start and end time of two flares, i.e. C1.4 and C3.7 in ARs 11226, and 11227, respectively.
Current usage metrics show cumulative count of Article Views (full-text article views including HTML views, PDF and ePub downloads, according to the available data) and Abstracts Views on Vision4Press platform.
Data correspond to usage on the plateform after 2015. The current usage metrics is available 48-96 hours after online publication and is updated daily on week days.
Initial download of the metrics may take a while.