Fig. 1
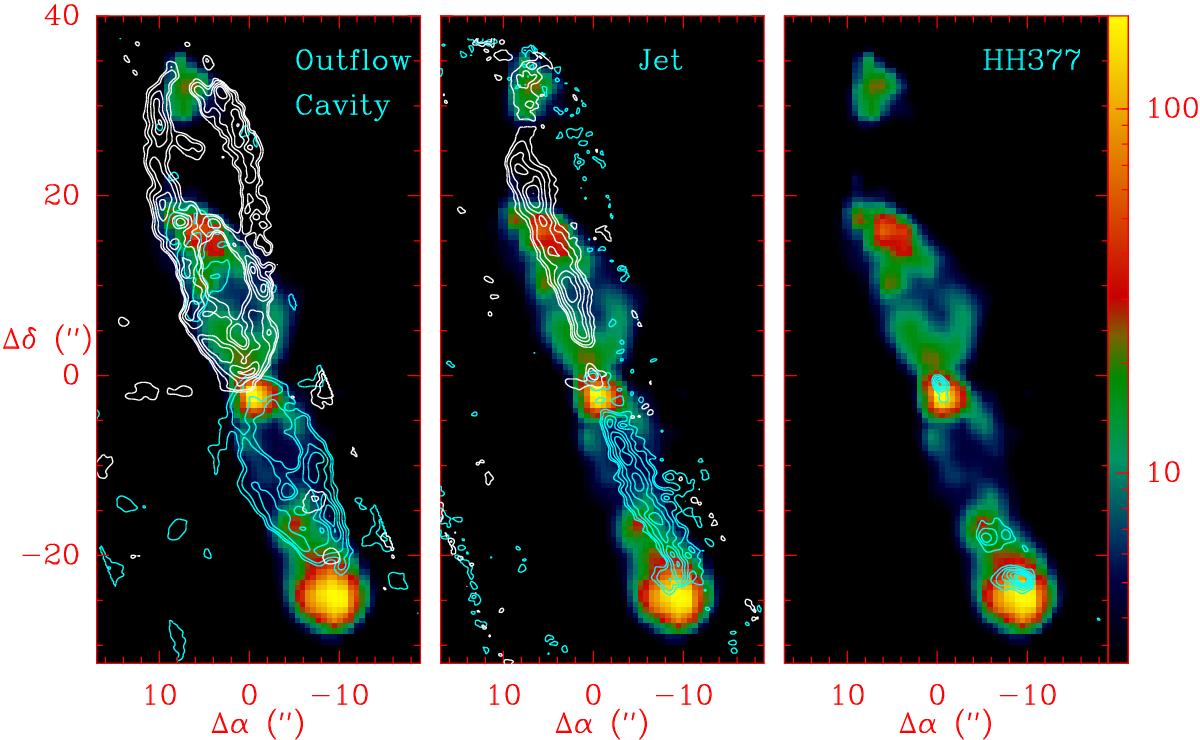
Cep E outflow emission observed in the CO J = 2–1 line with the PdBI at 1″ resolution (contours) and with IRAC/Spitzer H24.5 μm line (color). Each panel shows the emission associated with each of the three outflow components identified: (left) outflow cavity walls emission, integrated between −15.2 and −8.7 km s-1 in the southern lobe (blue contours) and between −2.2 and −8.7 km s-1 in the northern lobe (white contours); (center) jet emission integrated between −135 and −110 km s-1 and between +40 and +80 km s-1 towards the southern (blue contours) and northern lobes (white contours), respectively; (right) HH377 bowshock emission integrated between −77 and −64 km s-1 (blue contours). First contour and contour interval are 20% and 10% of the peak intensity, respectively.
Current usage metrics show cumulative count of Article Views (full-text article views including HTML views, PDF and ePub downloads, according to the available data) and Abstracts Views on Vision4Press platform.
Data correspond to usage on the plateform after 2015. The current usage metrics is available 48-96 hours after online publication and is updated daily on week days.
Initial download of the metrics may take a while.