Free Access
Fig. 9
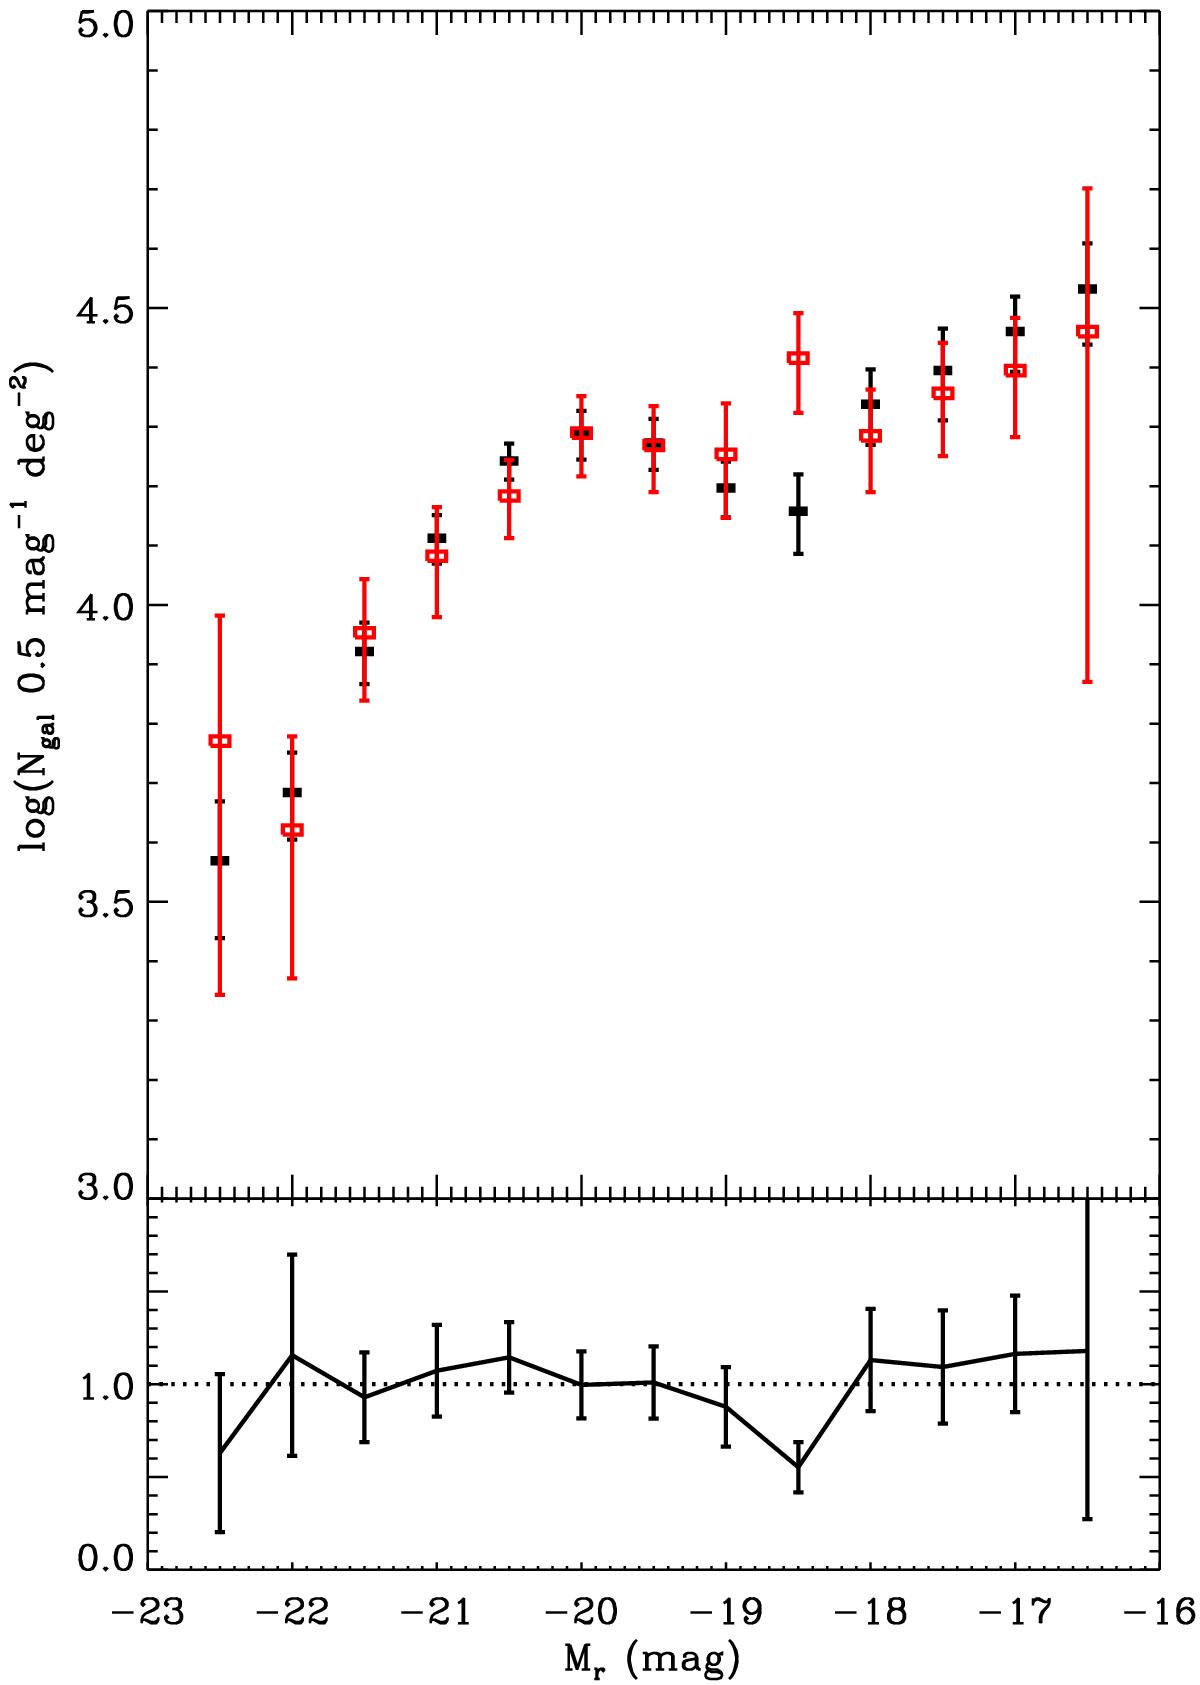
Stacked LFs for both clusters (black filled rectangles) and groups (red open rectangles) in the upper panel. Here we considered objects with σv ≤ 580 km s-1 as groups and objects with σv> 580 km s-1 as clusters.The ratio of the two LFs is plotted in the lower one.
Current usage metrics show cumulative count of Article Views (full-text article views including HTML views, PDF and ePub downloads, according to the available data) and Abstracts Views on Vision4Press platform.
Data correspond to usage on the plateform after 2015. The current usage metrics is available 48-96 hours after online publication and is updated daily on week days.
Initial download of the metrics may take a while.