Fig. 4
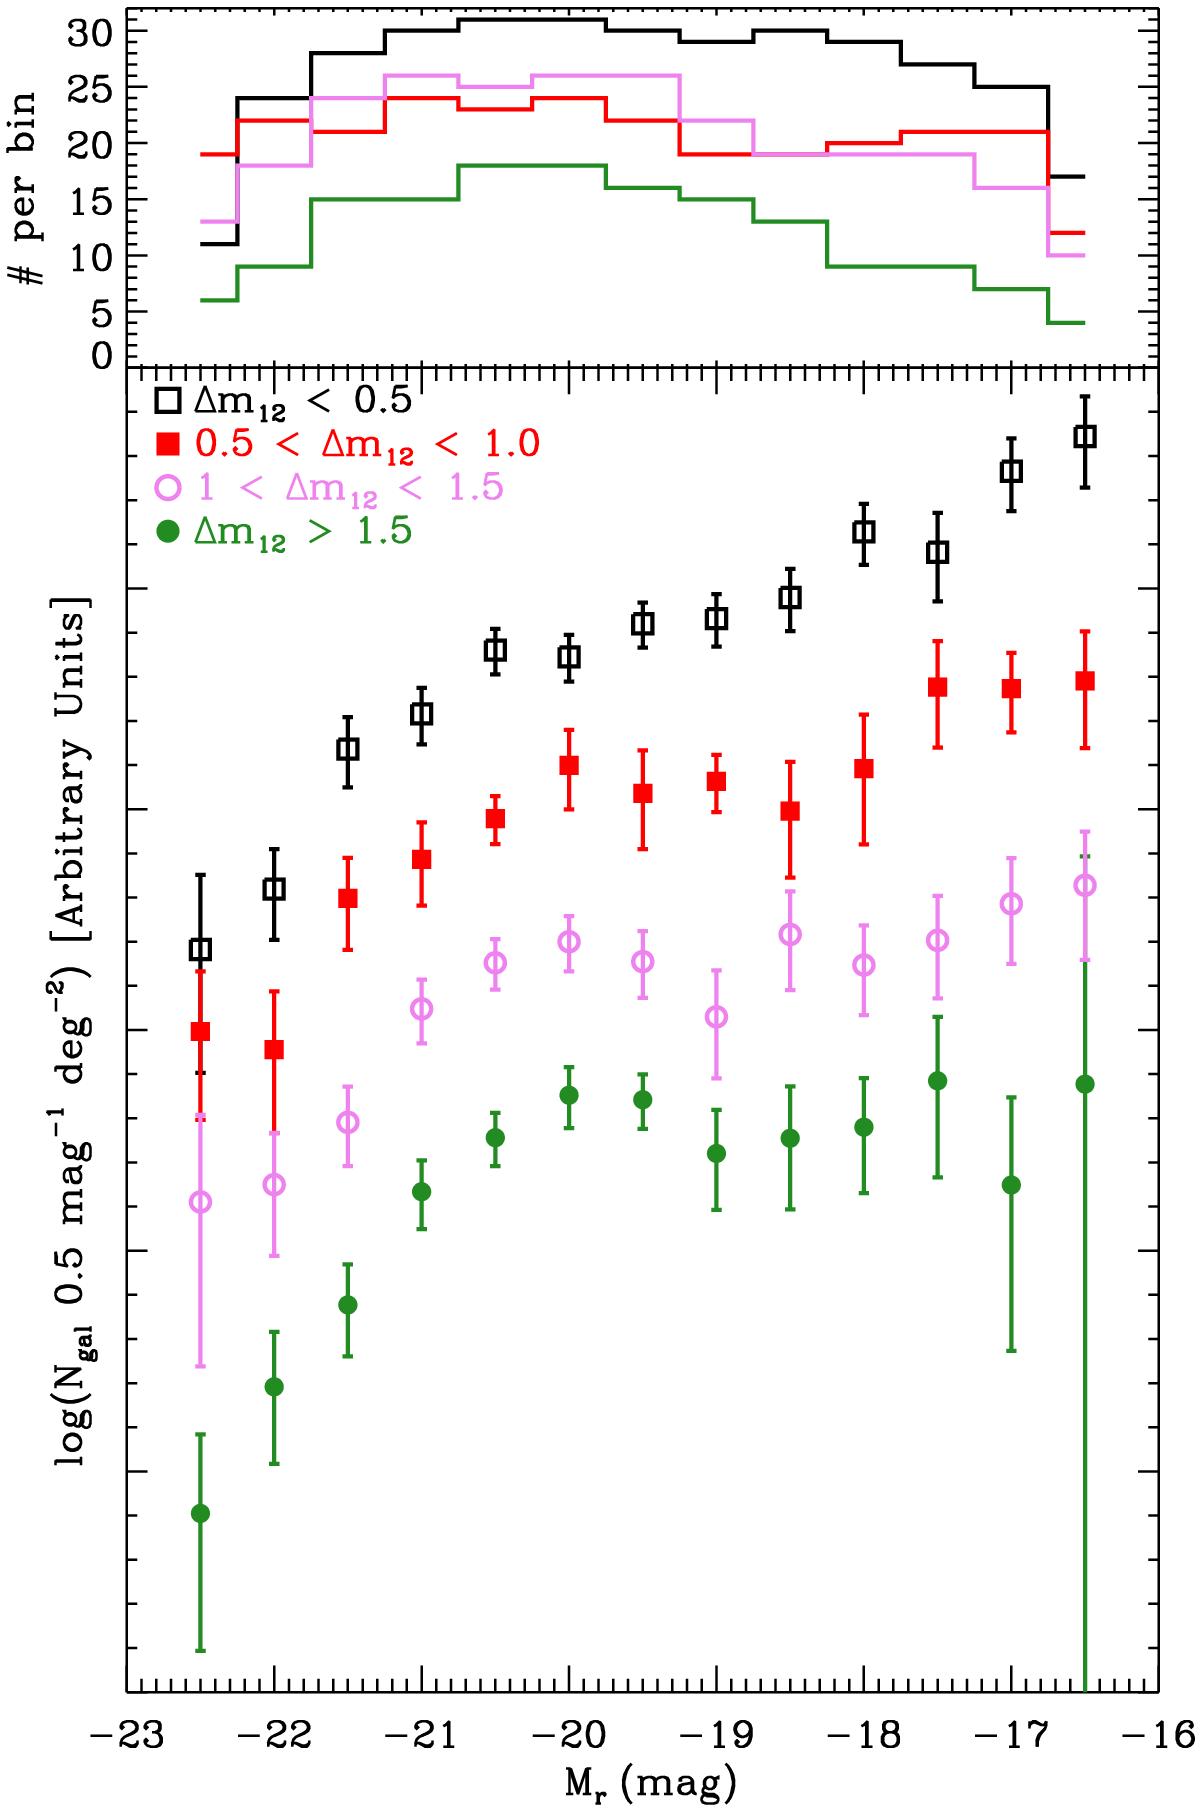
Lower panel: stacked LFs of systems with different gaps in magnitude. Black open squares are systems with gap ≤0.5, red filled squares represent systems with 0.5 < Δm12 ≤ 1.0, violet open circles indicate systems with 1 < Δm12 ≤ 1.5, and green filled circles are systems with gap ≥1.5. The four LFs have been moved by an arbitrary offset for display purposes. Upper panel: histogram of the number of systems that are contributing to each bin. The color code is the same as in the lower panel.
Current usage metrics show cumulative count of Article Views (full-text article views including HTML views, PDF and ePub downloads, according to the available data) and Abstracts Views on Vision4Press platform.
Data correspond to usage on the plateform after 2015. The current usage metrics is available 48-96 hours after online publication and is updated daily on week days.
Initial download of the metrics may take a while.