Free Access
Fig. 3
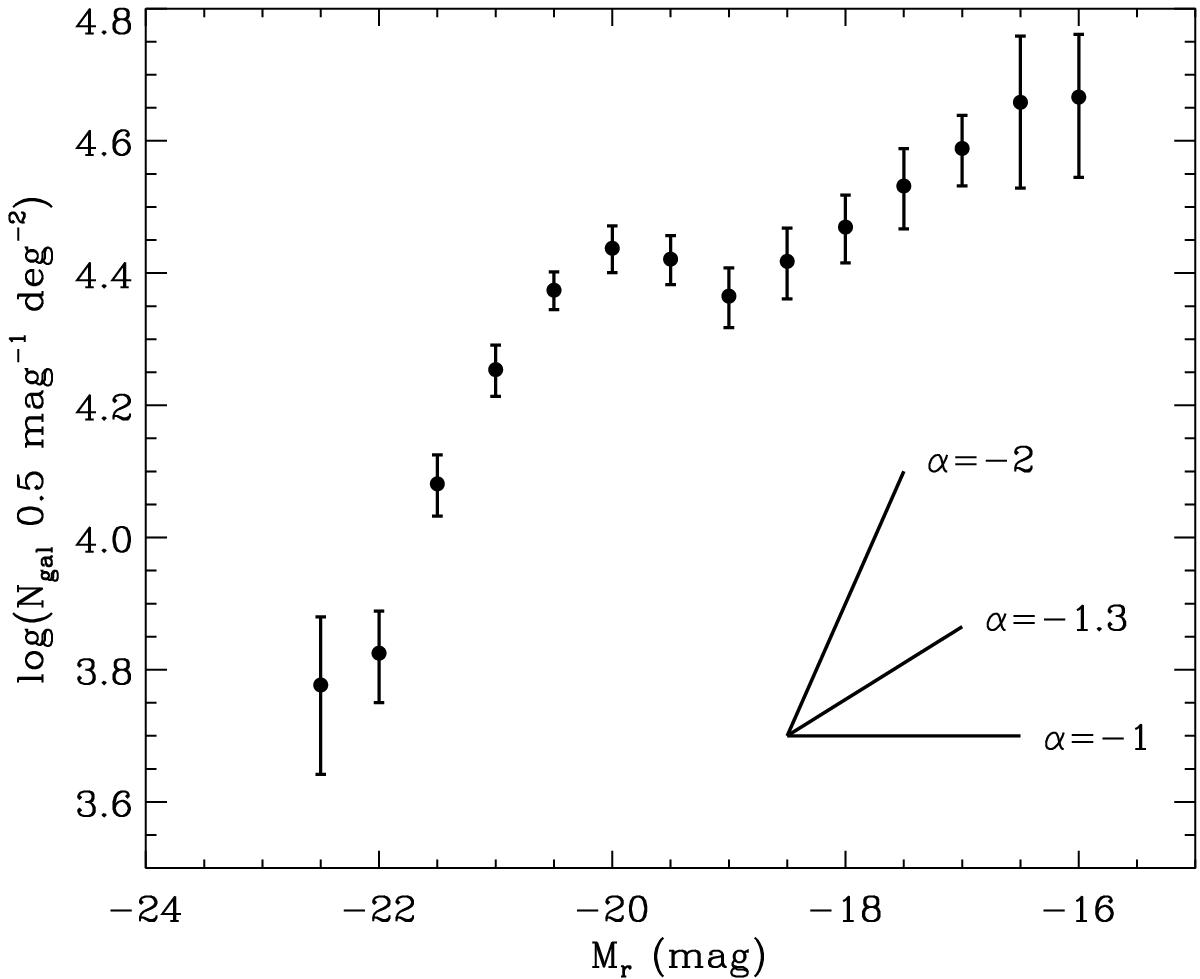
Stacked LF for all the systems of our sample with z ≤ 0.25. The solid lines represent the faint-end slope for α = −2.0, which is the value predicted by standard CDM theories, α = −1.3, obtained from our fit, and α = −1.0, which is the value for a flat LF.
Current usage metrics show cumulative count of Article Views (full-text article views including HTML views, PDF and ePub downloads, according to the available data) and Abstracts Views on Vision4Press platform.
Data correspond to usage on the plateform after 2015. The current usage metrics is available 48-96 hours after online publication and is updated daily on week days.
Initial download of the metrics may take a while.