Free Access
Fig. 10
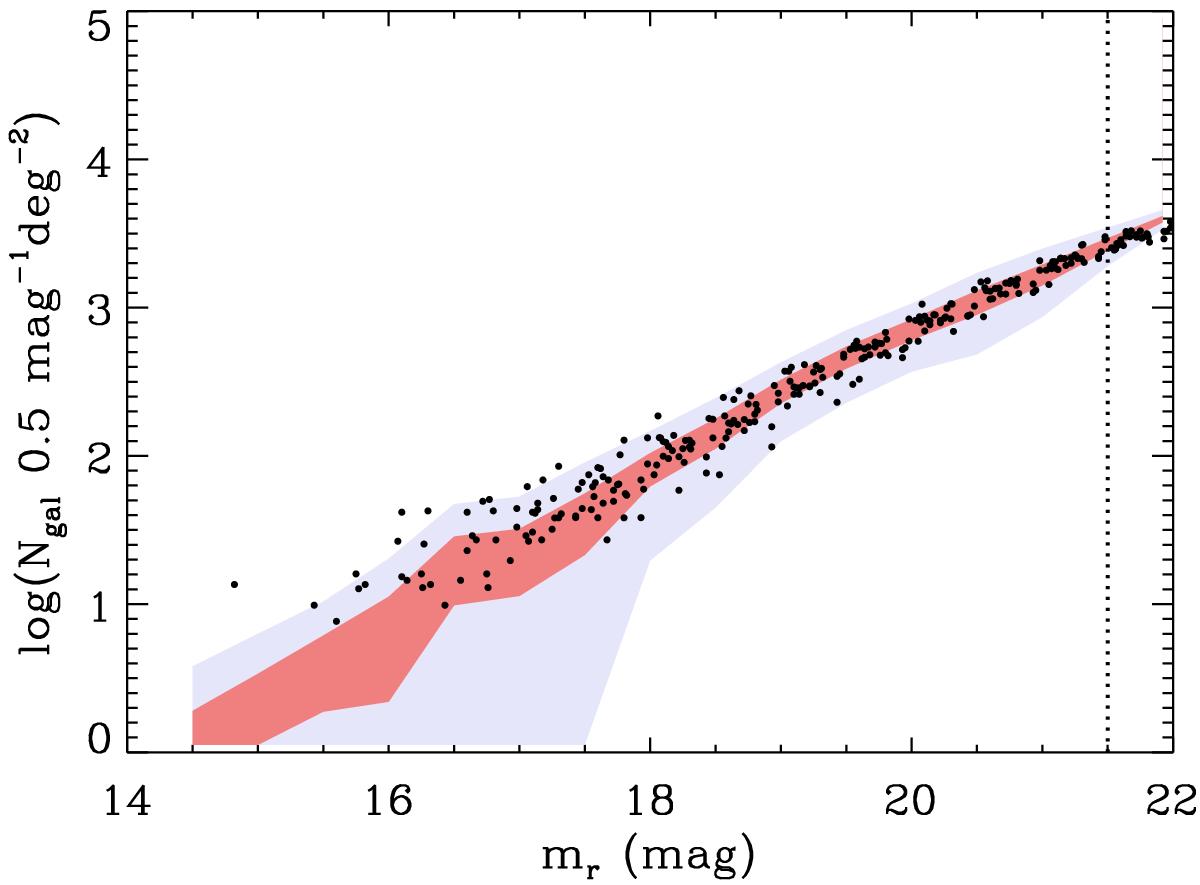
Local background (black dots) superimposed on the 1σ and 3σ contours of the global background (red and gray shaded areas, respectively). The vertical dotted line is the completeness limit of this work.
Current usage metrics show cumulative count of Article Views (full-text article views including HTML views, PDF and ePub downloads, according to the available data) and Abstracts Views on Vision4Press platform.
Data correspond to usage on the plateform after 2015. The current usage metrics is available 48-96 hours after online publication and is updated daily on week days.
Initial download of the metrics may take a while.