Free Access
Fig. 8
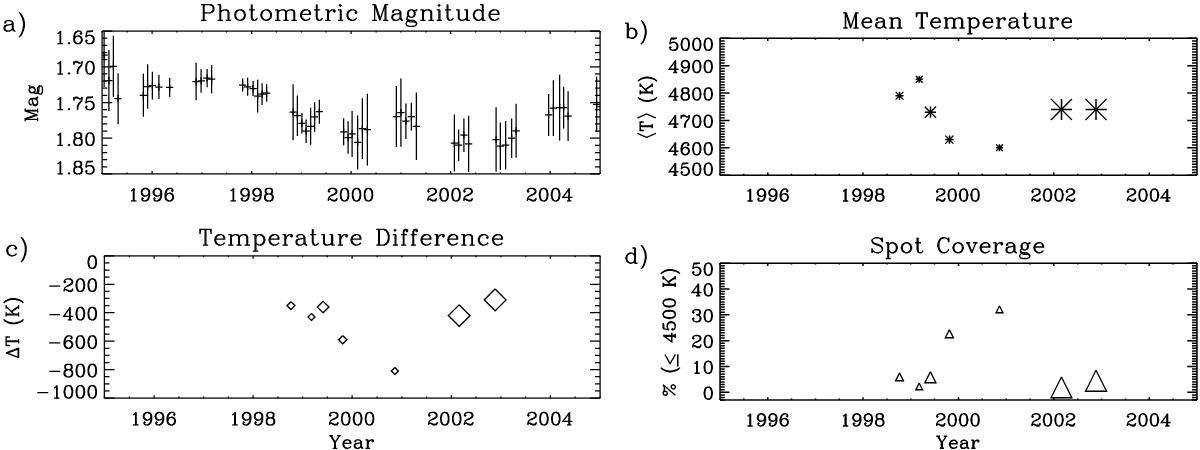
Top-left: photometric magnitude from Lehtinen et al. (2012a). Top-right: mean temperature of DI maps. Bottom-left: greatest temperature difference from the mean. Bottom-right: percentage of surface less than or equal to 4500 K. Symbol sizes are proportional to the S/N and phase coverage.
This figure is made of several images, please see below:
Current usage metrics show cumulative count of Article Views (full-text article views including HTML views, PDF and ePub downloads, according to the available data) and Abstracts Views on Vision4Press platform.
Data correspond to usage on the plateform after 2015. The current usage metrics is available 48-96 hours after online publication and is updated daily on week days.
Initial download of the metrics may take a while.