Fig. 1
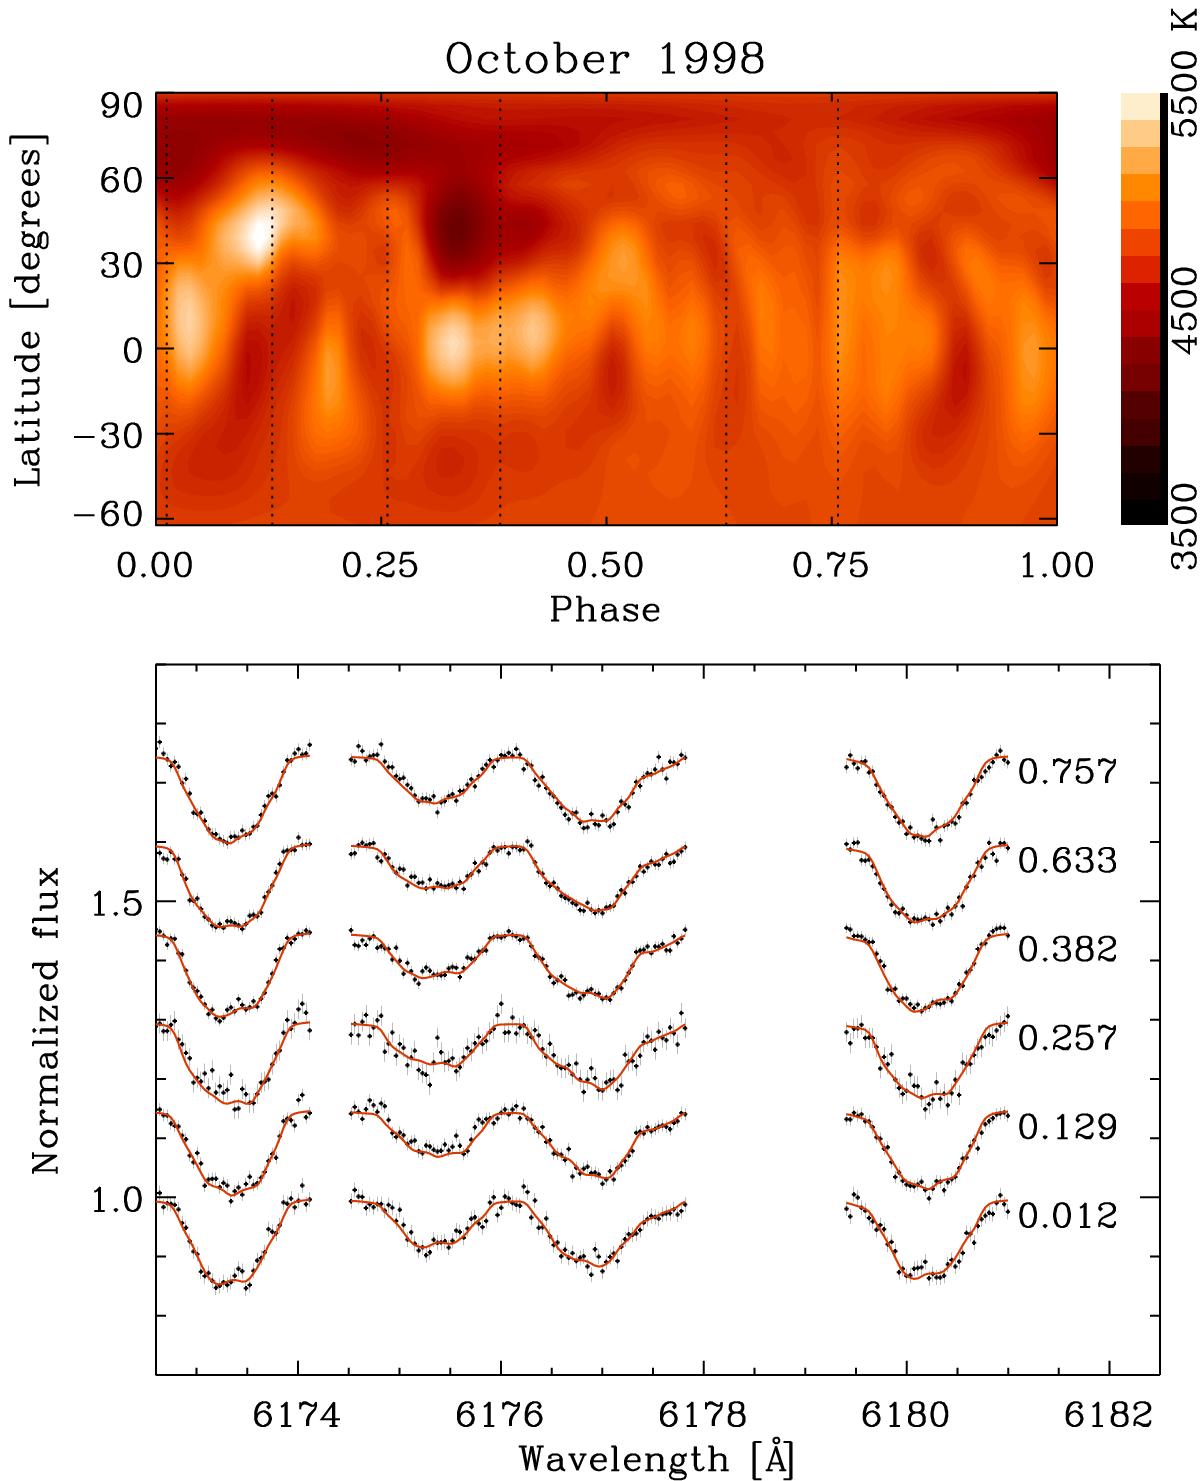
Top: temperature map in equirectangular projection. The phase is defined in Eq. (1), and phases of observations are marked by vertical dashed lines. Bottom: normalized flux of the spectral region used for the inversion. Points are observations with error, the solid red line is the model calculated from the DI solution. The phase of each observation is listed to the right of the lines.
Current usage metrics show cumulative count of Article Views (full-text article views including HTML views, PDF and ePub downloads, according to the available data) and Abstracts Views on Vision4Press platform.
Data correspond to usage on the plateform after 2015. The current usage metrics is available 48-96 hours after online publication and is updated daily on week days.
Initial download of the metrics may take a while.