Fig. A.1
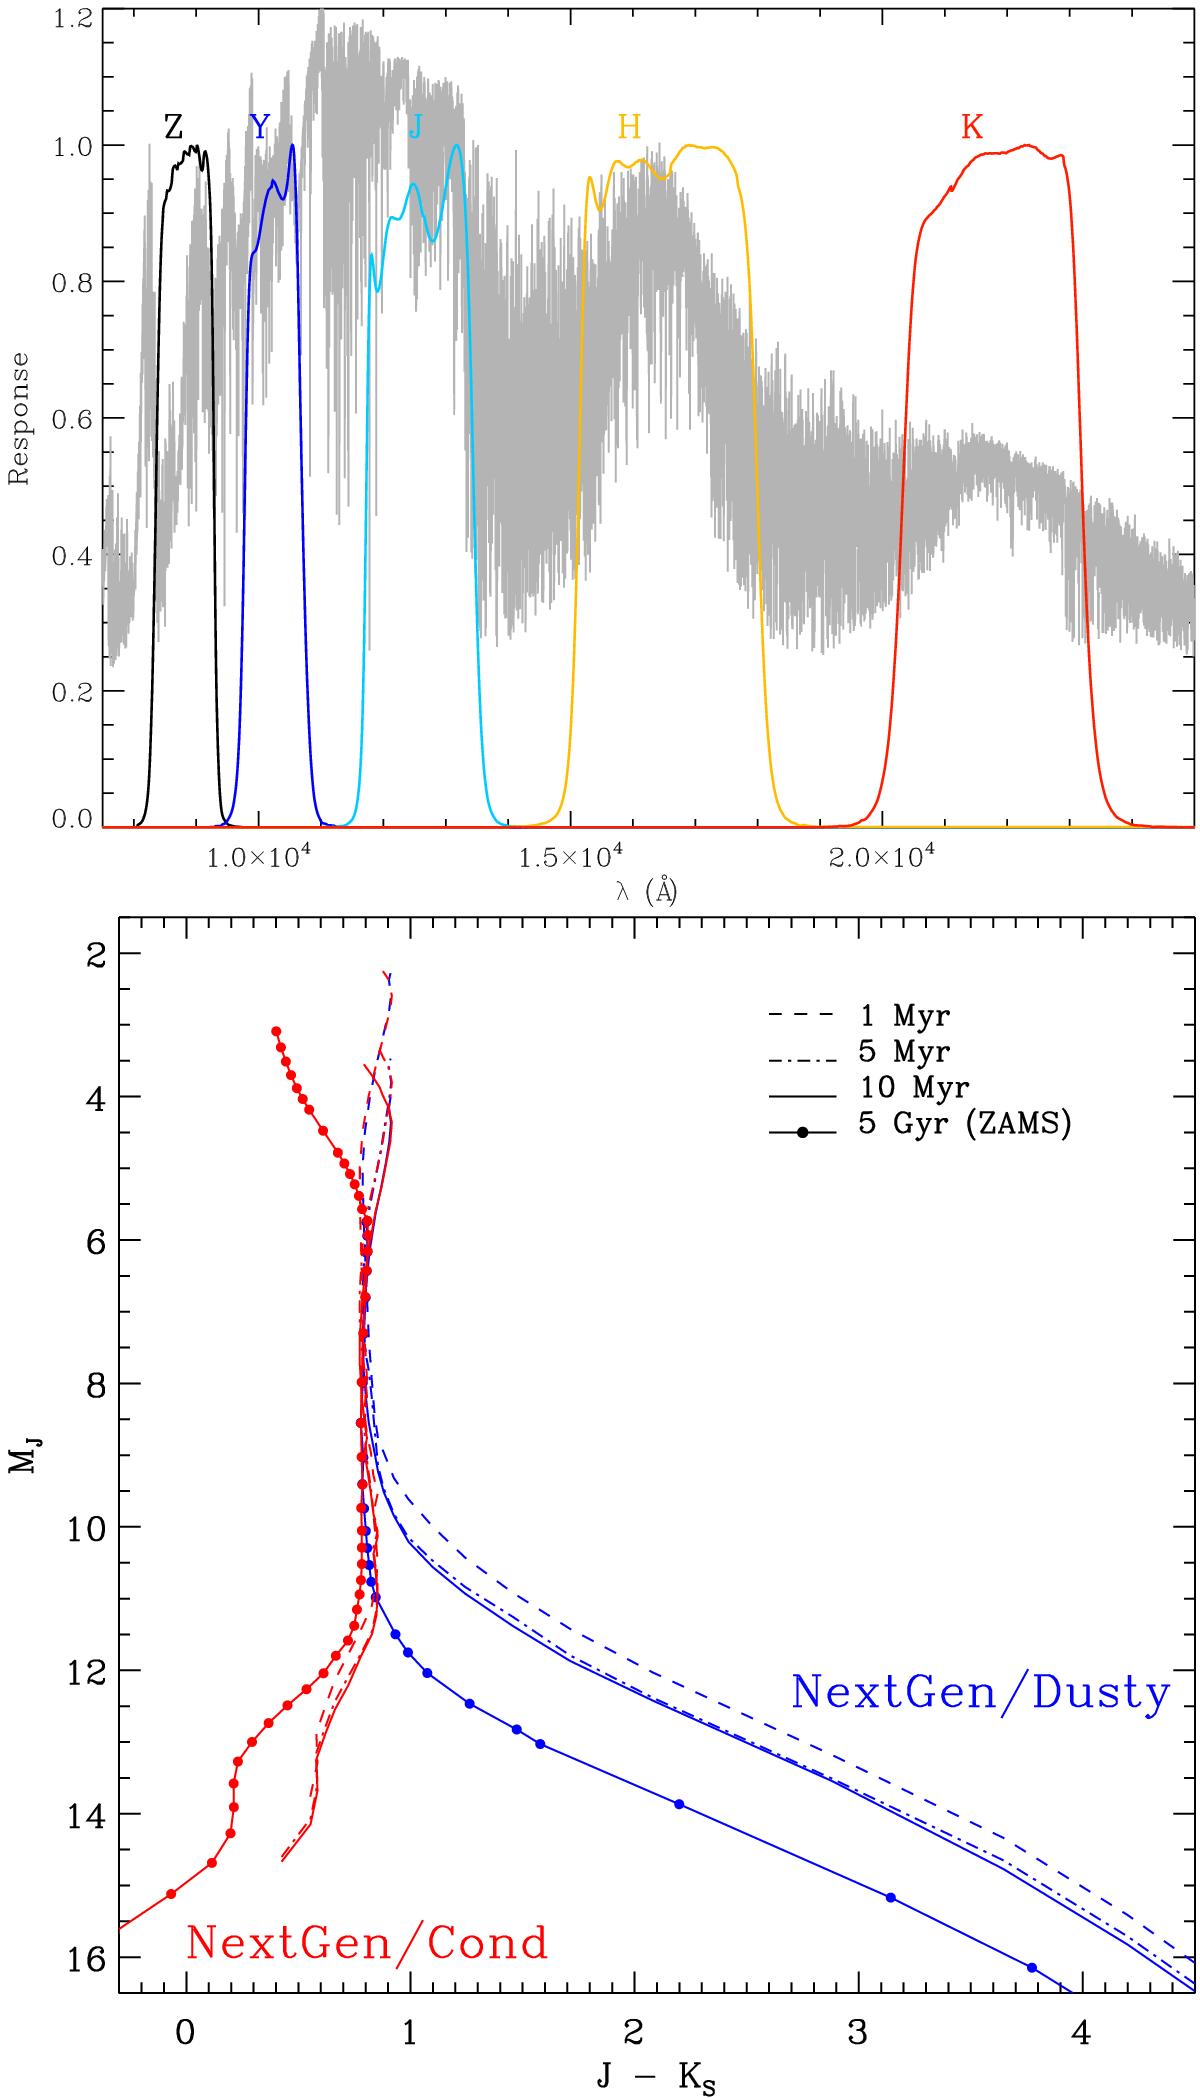
Upper panel: the ZYJHKS VISTA transmission bands. An example of a normalized NextGen spectrum (Hauschildt et al. 1999) with Teff = 2500 K is overplotted. Lower panel: theoretical MJ vs. J − KS diagram. The isochrones, shifted to the distance of 10 pc (i.e., absolute magnitudes), are in the VISTA photometric system. Different curve styles correspond to different ages, as indicated in the legend. We plot in blue the isochrones computed using the NextGen/AMES-Dusty atmospheric models, and in red those computed using the NextGen/AMES-Cond models.
Current usage metrics show cumulative count of Article Views (full-text article views including HTML views, PDF and ePub downloads, according to the available data) and Abstracts Views on Vision4Press platform.
Data correspond to usage on the plateform after 2015. The current usage metrics is available 48-96 hours after online publication and is updated daily on week days.
Initial download of the metrics may take a while.