Fig. 5
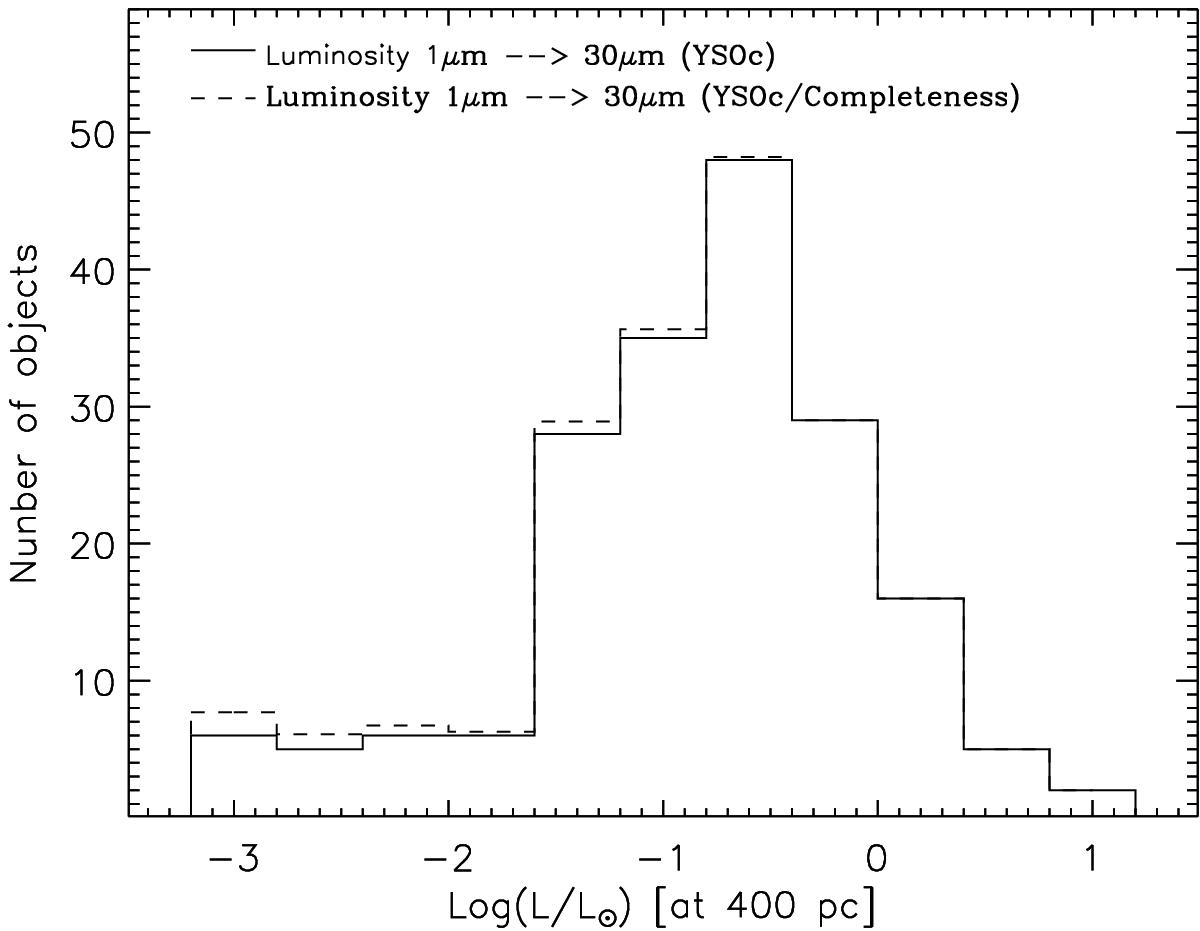
Luminosity distribution for the YSOc in L1630 N (solid histogram). The plotted luminosities were determined as in Harvey et al. (2007a), i.e., by integration of the SEDs from 1 to 30 μm. The corrected luminosity distribution, determined by applying completeness factors at each luminosity bin as in Harvey et al. (2007a), is over-plotted (dashed histogram).
Current usage metrics show cumulative count of Article Views (full-text article views including HTML views, PDF and ePub downloads, according to the available data) and Abstracts Views on Vision4Press platform.
Data correspond to usage on the plateform after 2015. The current usage metrics is available 48-96 hours after online publication and is updated daily on week days.
Initial download of the metrics may take a while.