Fig. 8
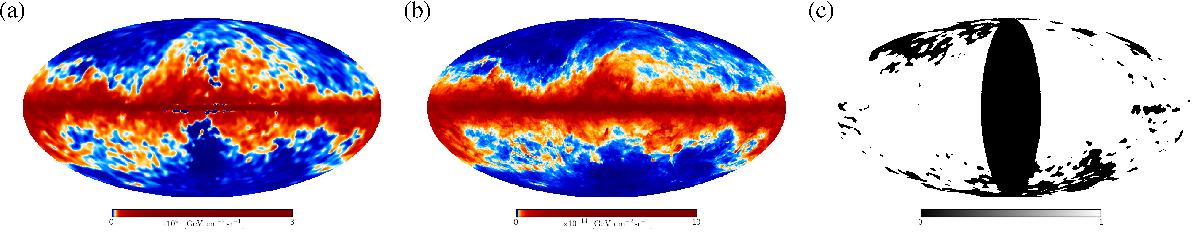
Illustration of the brightness in a Mollweide projection. Panel a) shows the integrated brightness of the cloud-like component. Panel b) shows the monochromatic brightness of thermal dust emission at 353 GHz (Planck Collaboration XI 2014). Panel c) shows in white the area that was included in computing the latitude profile in Fig. 9.
Current usage metrics show cumulative count of Article Views (full-text article views including HTML views, PDF and ePub downloads, according to the available data) and Abstracts Views on Vision4Press platform.
Data correspond to usage on the plateform after 2015. The current usage metrics is available 48-96 hours after online publication and is updated daily on week days.
Initial download of the metrics may take a while.