Fig. 6
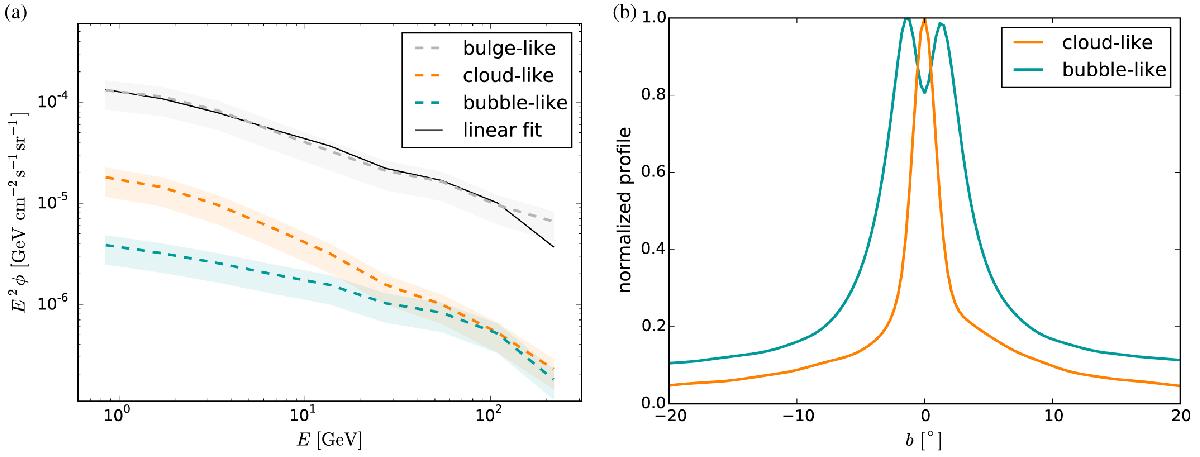
Cloud- and bubble-like component. Panel a) shows energy spectra from ROIs defined in Fig. 3g, cf. text. In addition to the spectra retrieved from the different regions, a linear combination of the cloud-, and bubble-like is fit to the bulge-like component, cf. legend. Panel b) shows the normalized latitude profiles of the cloud- and bubble-like component.
Current usage metrics show cumulative count of Article Views (full-text article views including HTML views, PDF and ePub downloads, according to the available data) and Abstracts Views on Vision4Press platform.
Data correspond to usage on the plateform after 2015. The current usage metrics is available 48-96 hours after online publication and is updated daily on week days.
Initial download of the metrics may take a while.