Fig. 4
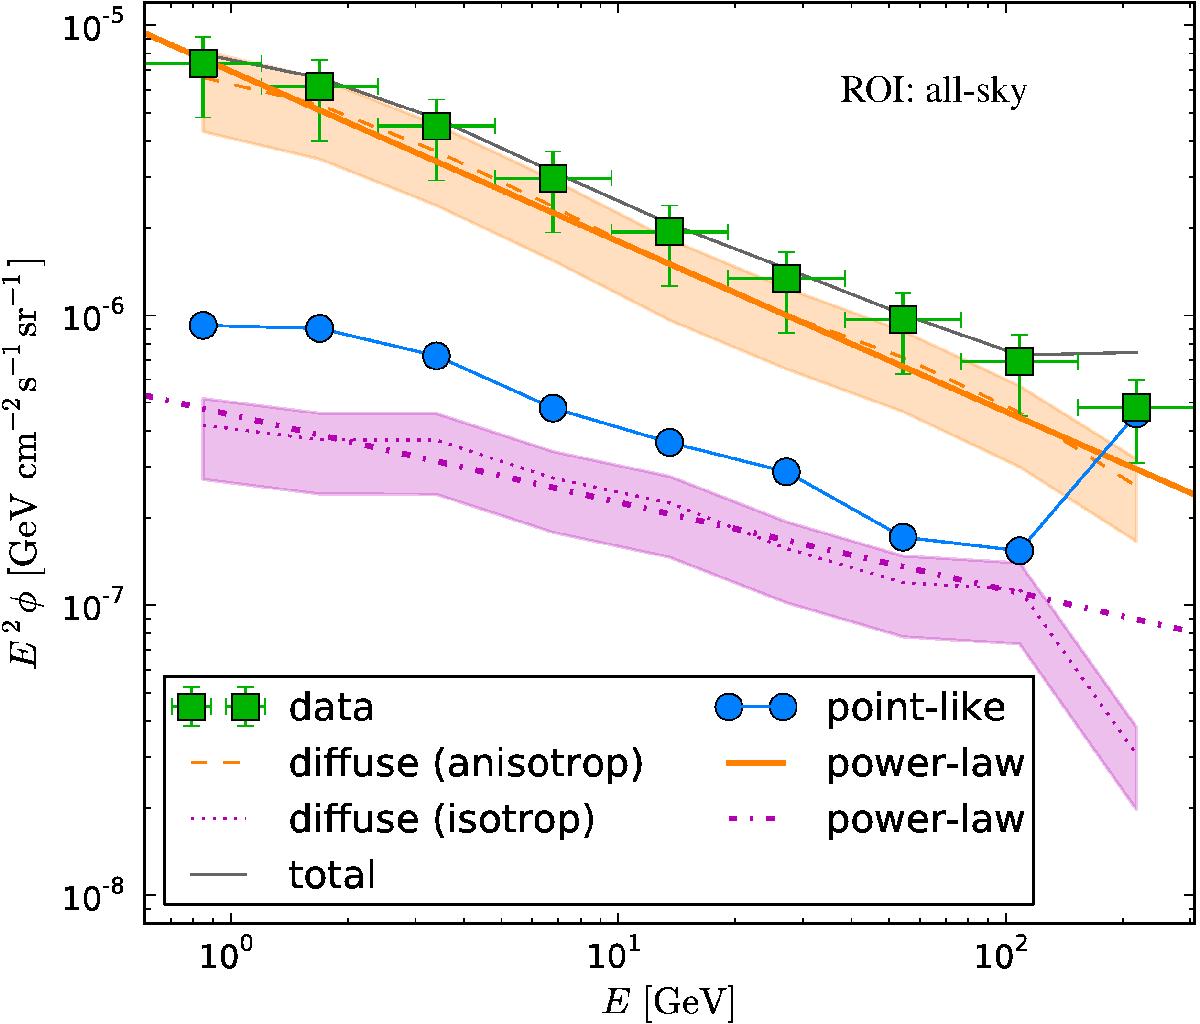
Energy spectra considering an all-sky ROI. Shown are the data (green squares) converted to flux units, and spectra from the reconstructed total (gray), anisotropic diffuse (dashed orange), isotropic diffuse (dotted magenta), and point-like photon flux (blue circles). Furthermore, power-law fits for the anisotropic (thick solid orange) and isotropic emission (thick dashed-dotted magenta) are shown. The errors include statistical and systematic uncertainties and are only shown for data and diffuse contributions for reasons of clarity.
Current usage metrics show cumulative count of Article Views (full-text article views including HTML views, PDF and ePub downloads, according to the available data) and Abstracts Views on Vision4Press platform.
Data correspond to usage on the plateform after 2015. The current usage metrics is available 48-96 hours after online publication and is updated daily on week days.
Initial download of the metrics may take a while.