Fig. 3
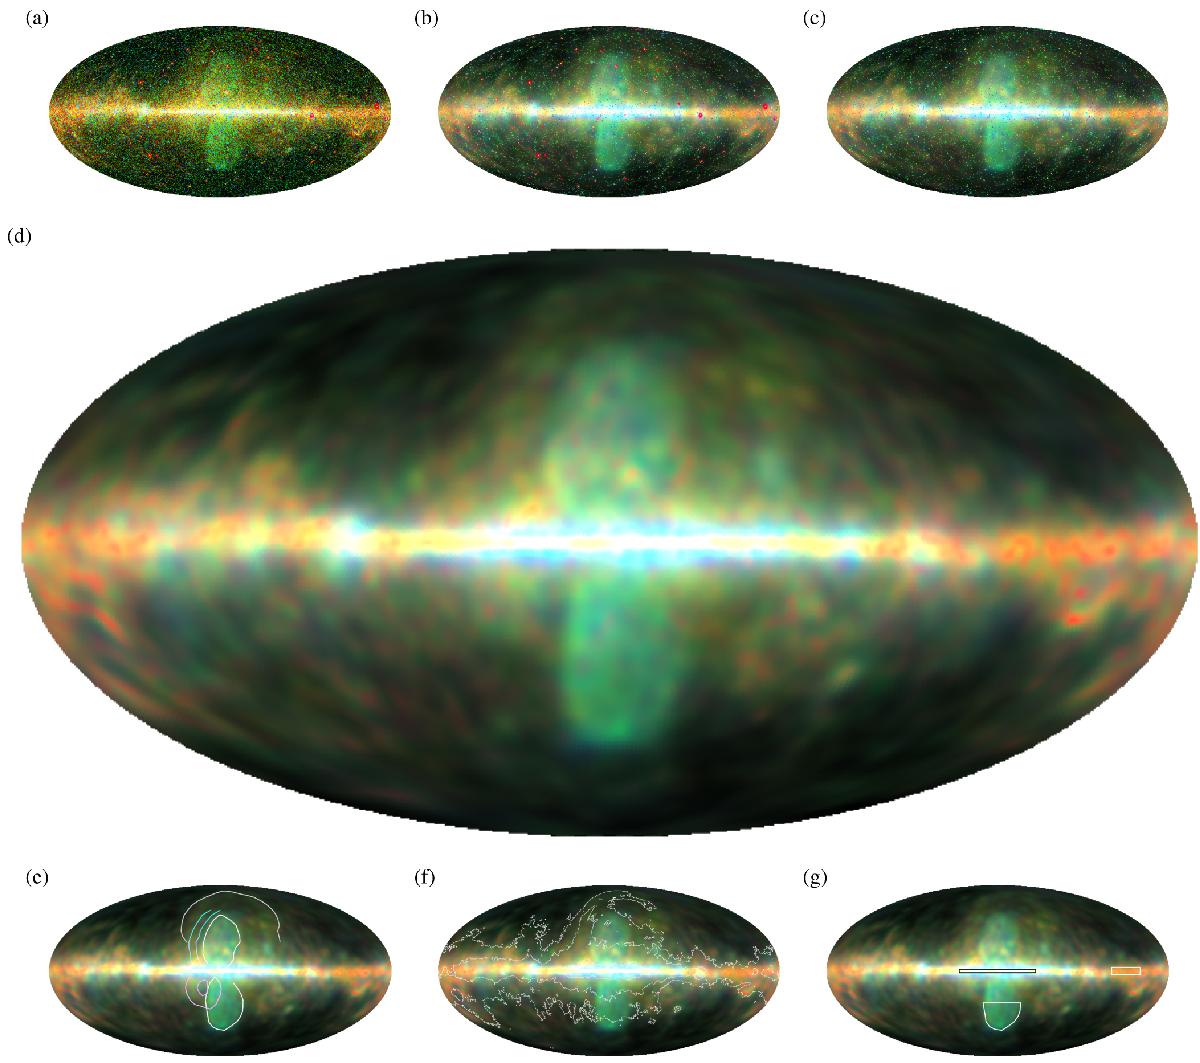
γ-ray sky in pseudocolor in a Mollweide projection. Panel a) shows the 6.5 year data. Panels b) and c) show the reconstructed (total) photon flux that in b) is reconvolved with the IRFs. Panel d) shows the reconstructed diffuse photon flux. Panels e) and f) reproduce the latter, but are overlaid with the feature contours found by Su et al. (2010) (white: giant Fermi bubbles, light magenta: Donut, light blue: North Arc, light gray: Radio Loop I) and contours of the 408 MHz radio map from Haslam et al. (1982). Panel g) highlights the contours defining the bulge-, cloud-, and bubble-like regions discussed in Sect. 3.3.
Current usage metrics show cumulative count of Article Views (full-text article views including HTML views, PDF and ePub downloads, according to the available data) and Abstracts Views on Vision4Press platform.
Data correspond to usage on the plateform after 2015. The current usage metrics is available 48-96 hours after online publication and is updated daily on week days.
Initial download of the metrics may take a while.