Fig. 13
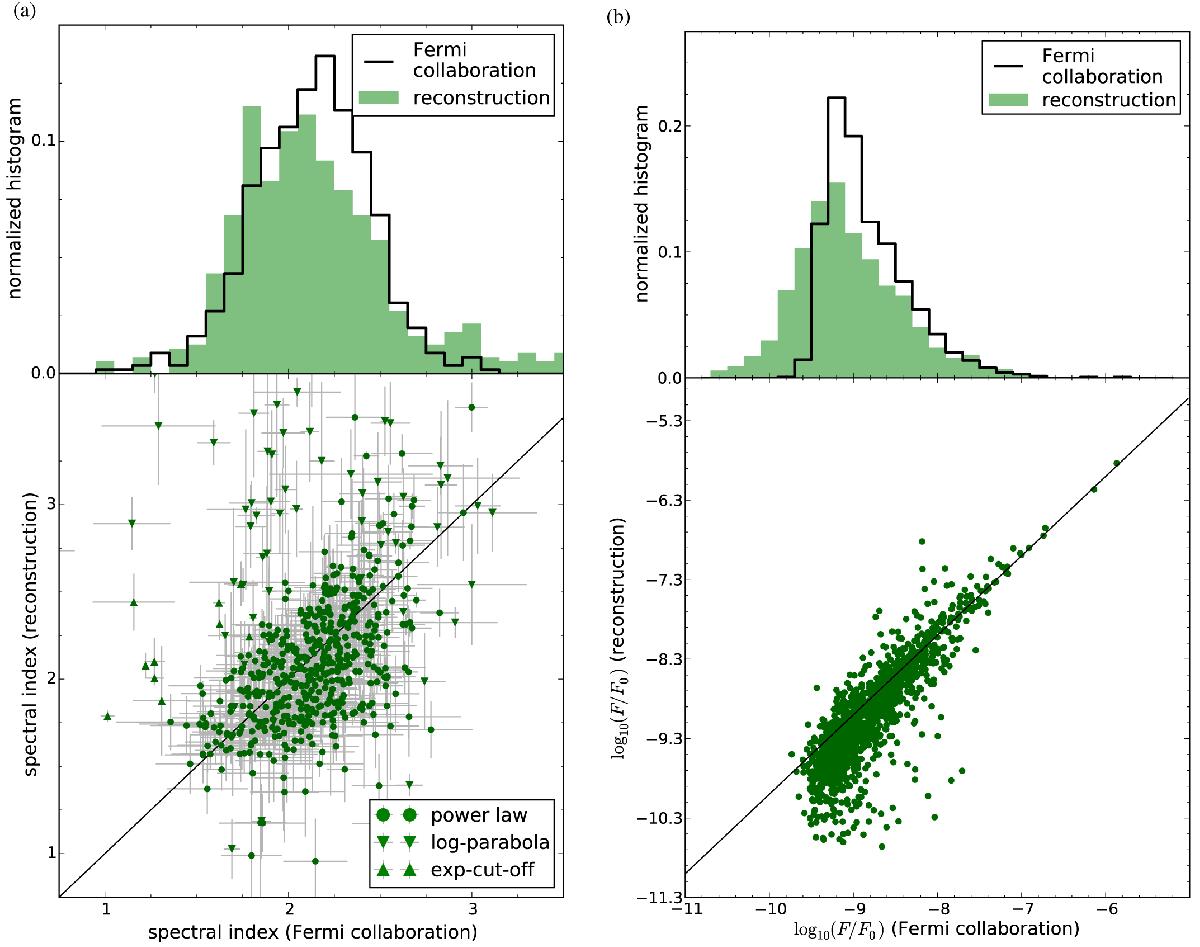
Comparison of the second Fermi LAT source catalog (Nolan et al. 2012) and candidates from the reconstruction for which an association in the second Fermi LAT catalog has been found. Panel a) shows the histogram and scatter plot of the spectral indices γ(u) of candidates versus catalog sources. In the latter, a 1:1 line (black solid) is plotted for comparison, and the markers indicate the fit spectral shape, cf. legend. Panel b) shows the histogram and scatter plot of the logarithmic total fluxes log 10(F/F0), where F0 = 1 cm-2 s-1. The scatter plot contains a 1:1 line (black solid) for comparison.
Current usage metrics show cumulative count of Article Views (full-text article views including HTML views, PDF and ePub downloads, according to the available data) and Abstracts Views on Vision4Press platform.
Data correspond to usage on the plateform after 2015. The current usage metrics is available 48-96 hours after online publication and is updated daily on week days.
Initial download of the metrics may take a while.